
Does employers’ worker poaching explain the Beveridge curve’s odd behavior?
Over nearly 100 years, economists have discovered and become accustomed to the idea that the number of unemployed individuals moves in the opposite direction to the number of available jobs.
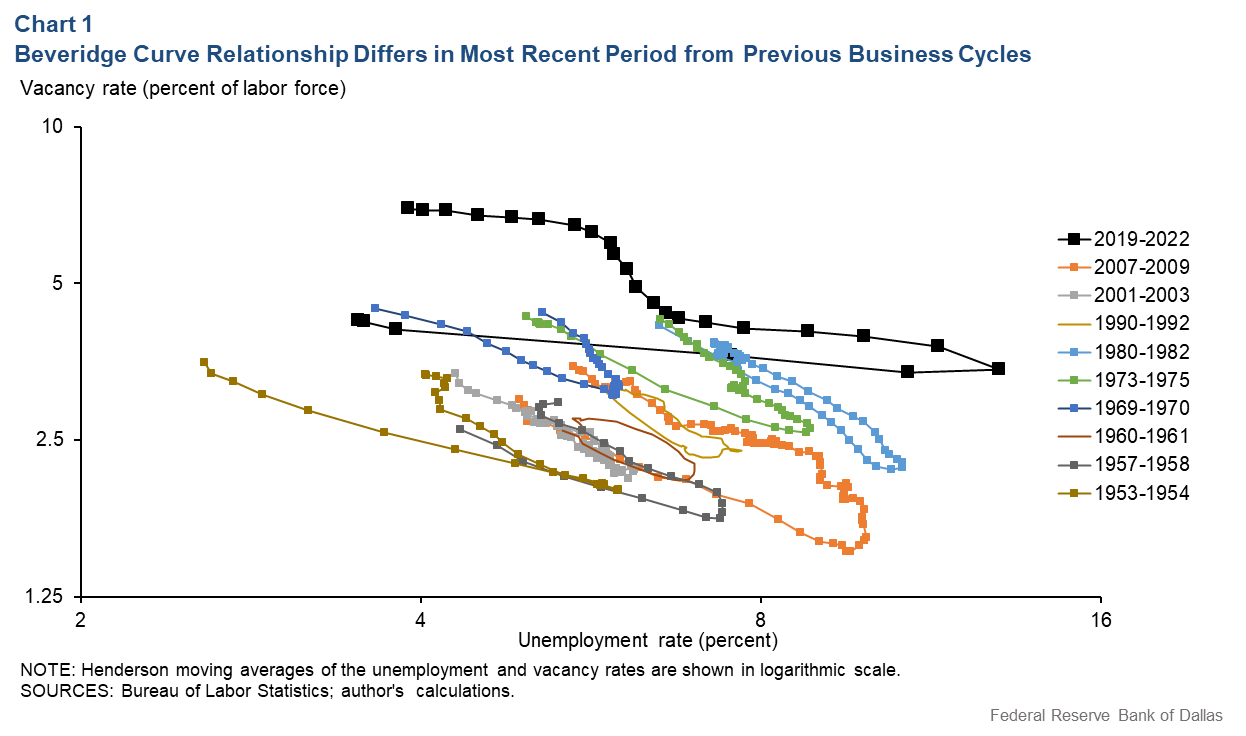
The simple observation that the number of jobs increases and unemployment declines in booms, while the opposite movement occurs in recessions, has been depicted by the Beveridge curve, named for the British economist William Beveridge (1879–1963), who first described the relationship in 1944.
The relationship is labeled a curve because when the vacancy rate is plotted relative to the unemployment rate—over any recession-and-recovery period—it yields a negatively sloped line.
The COVID-19 recession, the most recent episode, appears strikingly different. While all previous recession–recovery episodes showed tight movement along clear lines with a similar negative slope, the 2020–22 recession–recovery period does not resemble such a relationship (Chart 1). The curve’s shift suggests that an alternative view of the Beveridge curve relationship may have merit.
Some economists have attributed the irregular shape of the curve to some of the same factors cited when the Beveridge curve shifted previously—less-efficient matching due to compositional changes in the labor force, changing skill requirements and other sources of mismatch.
Another proposed explanation is that newer technology is making it easier to search for a job but harder to convert a match into an offer. Other researchers have attributed the flattening of the curve to changes in the cost of remaining unemployed and to a larger-than-expected number of retirements. However, previous changes in the Beveridge curve have always been much smaller and taken longer to occur. Changes of this magnitude have never been previously observed.
Proposing an alternative explanation for odd-shaped curve
In a recent paper, I and a coauthor propose that a so-called dual vacancy model can explain the curve’s unusual shape. Consider two distinct types of job postings: one targeted at unemployed workers and the other designed to poach workers from existing positions at other firms.
The effects of these two kinds of job postings on the labor market are radically different. A posting designed for the unemployed—if it leads to a hire—reduces the unemployment rate and increases the employment rate. The job posting designed for poaching at best moves a worker between two positions and potentially increases their wage in the process but does not affect overall employment and unemployment.
The dual vacancy model takes the rather extreme view that these two types of job postings operate in separate, segmented markets, breaking the overall search and matching process into two non-overlapping processes.
Unemployed workers search for and match only with vacancies designed for the unemployed, and employed workers match only with poaching vacancies. Since poaching vacancies do not affect employment and unemployment, the Beveridge curve relationship only applies to the first submarket that matches unemployed workers with vacancies for the unemployed.
Under these assumptions, it is possible to separate empirically the total number of vacancies into those designed for the unemployed and those intended for poaching. Monthly data since 2000 from the Bureau of Labor Statistics’ Job Openings and Labor Turnover Survey (JOLTS) document the number of hires and quits. It is possible to break down the JOLTS data into those hired from the unemployment pool and those lured from other jobs.
In the JOLTS survey, the number of quits reflects voluntary separations, with the majority of cases due to finding another job. Thus, quits can proxy for the number of job-to-job switches, where one company poaches a worker from another company. The residual hires that did not come from quits are, therefore, hires from the unemployment pool.
Additionally, researchers using data from the Census Bureau’s Current Population Survey have constructed “unemployment-to-employment” and “employment-to-employment” transition rates. Combined with JOLTS data, these rates allow us to infer the search-effort inputs of unemployed workers and employed workers into their separate matching processes.
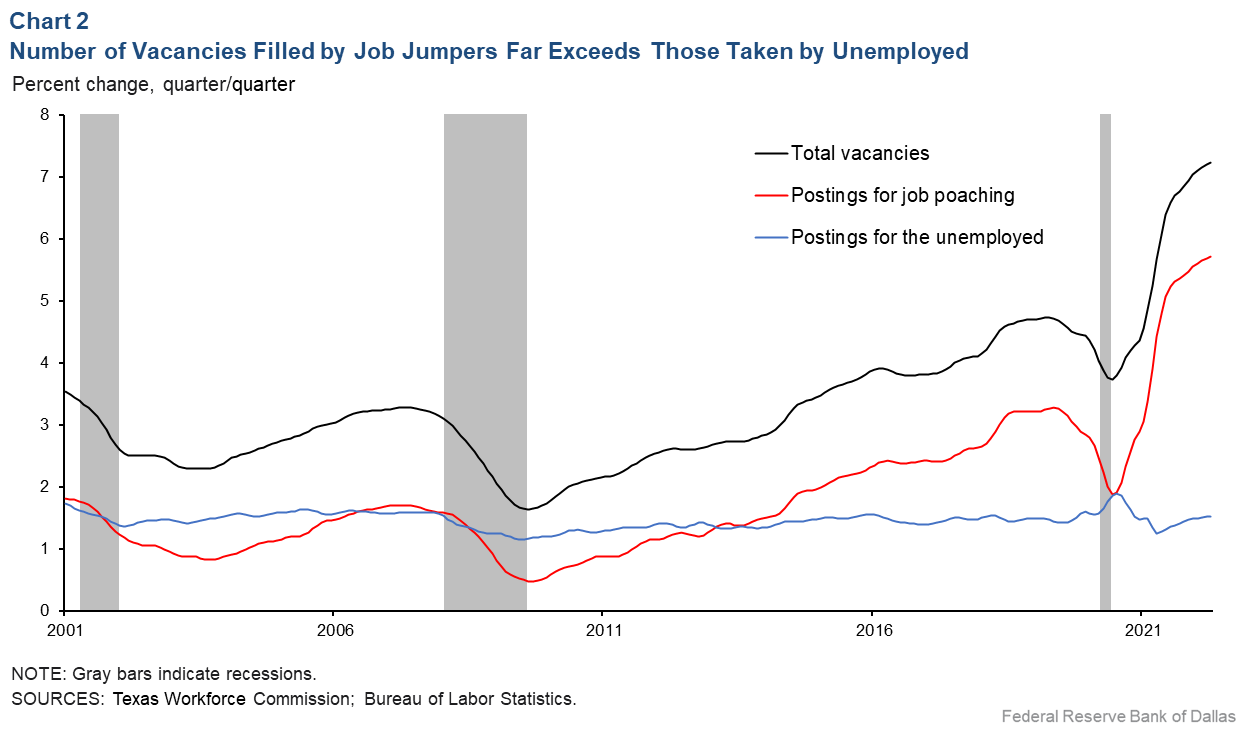
We can then break down the total job openings into those designed for the unemployed and those designed for poaching by using for both submarkets a form of the matching function common in the literature. This breakdown is computed for the period from 2000 to 2022 at a monthly frequency (Chart 2).
Fiscal, monetary stimulus propels excess hiring demand
There are two important observations. First, the fraction of poaching vacancies has increased significantly since approximately 2015 compared with the preceding period. This suggests that the reason that the Beveridge curve has shifted upward is due to a dramatic increase in nonproductive vacancies designed for poaching.
Second, though the business-cycle behavior of the two types of vacancies was similar in the first subperiod (from 2001 to 2019)—it dropped in recessions and recovered in booms—its behavior dramatically differed in the most recent recession episode. While poaching vacancies dropped in 2020 and quickly recovered, vacancies targeting the unemployed increased in the recession period.
To understand these observations, we need to look at them through the lens of an adjusted Beveridge curve. Recall that only vacancy postings designed to attract the unemployed can lead to increases in employment. Thus, the proper Beveridge curve relationship should only consider vacancies designed for the unemployed while disregarding poaching vacancies. Such an adjusted Beveridge curve, shown in Chart 3 (especially when jointly viewed with Chart 2), provides a clear interpretation of events.
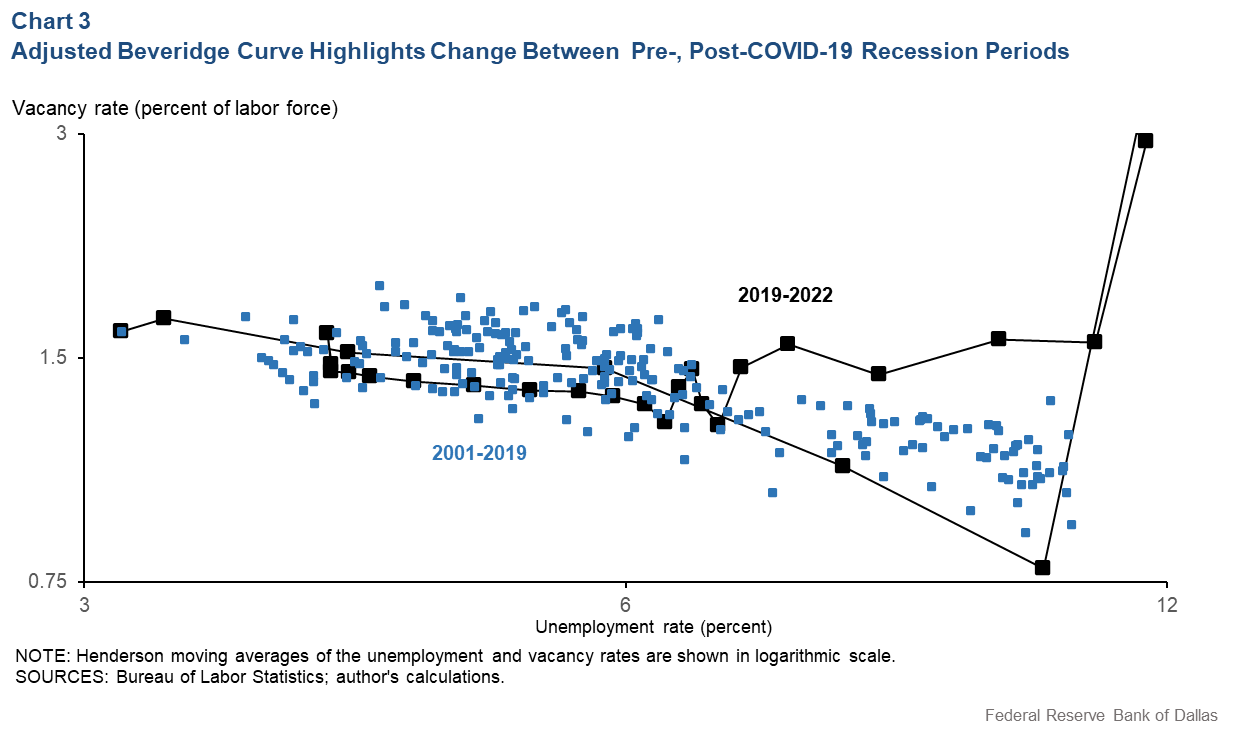
During the first two months of the pandemic, demand declined because of widespread social distancing, which increased unemployment and reduced poaching. In the next few months, mask and distancing mandates led to a separation shock in which many more people were laid off than would be consistent with lower demand. Vacancies designed for the unemployed increased, and a lot of people were very quickly hired from among the unemployment pool.
After the spike in hires from the unemployed ended, the effects of stimulative fiscal and monetary policy took hold, increasing purchasing power and creating strong demand for goods. Because of such added demand, firms wanted to expand. This demand for workers could not be satisfied by hires from the unemployment pool. Together with supply-chain bottlenecks, the excess demand for goods led to a surge in inflation, and excess demand for workers led to a poaching frenzy that then drove up wages.
Framing monetary policy in light of employment changes
This interpretation provides us with two lessons. First, the adjusted Beveridge curve focusing on the unemployed and vacancies remains intact. We can demonstrate this both at the aggregate and sectoral levels. Second, abnormalities in the classical Beveridge curve are due to a disproportionate expansion of poaching vacancies after 2015. However, we do not know the precise reason for this shift.
This result is important for policy considerations. A steeper Beveridge curve could imply that tighter monetary policy would result in a large decline in vacancies corresponding to only a mild increase in the unemployment rate. We attribute this puzzle to the disproportionate expansion of poaching vacancies. The policy implications depend on the reason for this expansion.
Dramatic improvement in vacancy posting technology could account for the expansion of poaching vacancies. In this case, the sensitivity of poaching vacancies to aggregate demand has increased. Thus, tighter monetary policy could lead to a disproportionate decline in poaching vacancies, with little impact on vacancies designed for the unemployed and only a small increase in unemployment.
Alternatively, the expansion of poaching vacancies could be due to a reduction in mismeasurement. As of 2011, 42 percent of hires occurred at establishments that ostensibly had no job openings. If all those firms accurately reported vacancies, the aggregate Beveridge curve would shift outward, though its slope wouldn’t change. Thus, monetary policy tightening could lead not only to a decrease in vacancies, but also to a proportional increase in the unemployment rate.
About the Author

Anton Cheremukhin
Cheremukhin is a senior research economist and advisor in the Research Department at the Federal Reserve Bank of Dallas.
The views expressed are those of the authors and should not be attributed to the Federal Reserve Bank of Dallas or the Federal Reserve System.