Treasuries’ allure as safe haven noted in short maturities, not in long bonds
The United States has a large negative net-foreign-asset position, especially in safe assets. In times of crisis, U.S. government debt, especially short-term Treasuries, are viewed as a safe haven. As a result, the U.S. is a net debtor. It is more leveraged and tends to hold more risky assets (mostly equities) and finances those positions by selling safe-asset debt to the rest of the world.
In normal times, this leads to the nation’s “exorbitant privilege”—it earns a higher return on its external assets than it pays on external liabilities. But in a crisis, this situation leads to the nation’s “exorbitant duty”—by holding risky assets financed with safe debt, a wealth transfer from the U.S. to the rest of the world occurs when risky asset prices fall.
In a previous article, I discussed how this exorbitant duty leads to an increase in the U.S. current account balance. U.S. households, faced with a fall in wealth relative to the rest of the world, increase their savings relative to the rest of the world.
U.S. total net inflows and net inflows in safe assets fell sharply during the 2007–09 financial crisis—U.S. net inflows are inflows (foreign purchases of U.S. assets) minus outflows (U.S. purchases of foreign assets). Safe-asset flows are flows in bonds and debt, while total flows include safe assets and risky assets (Chart 1). In balance-of-payments accounting, total net inflows are the negative of the current account.
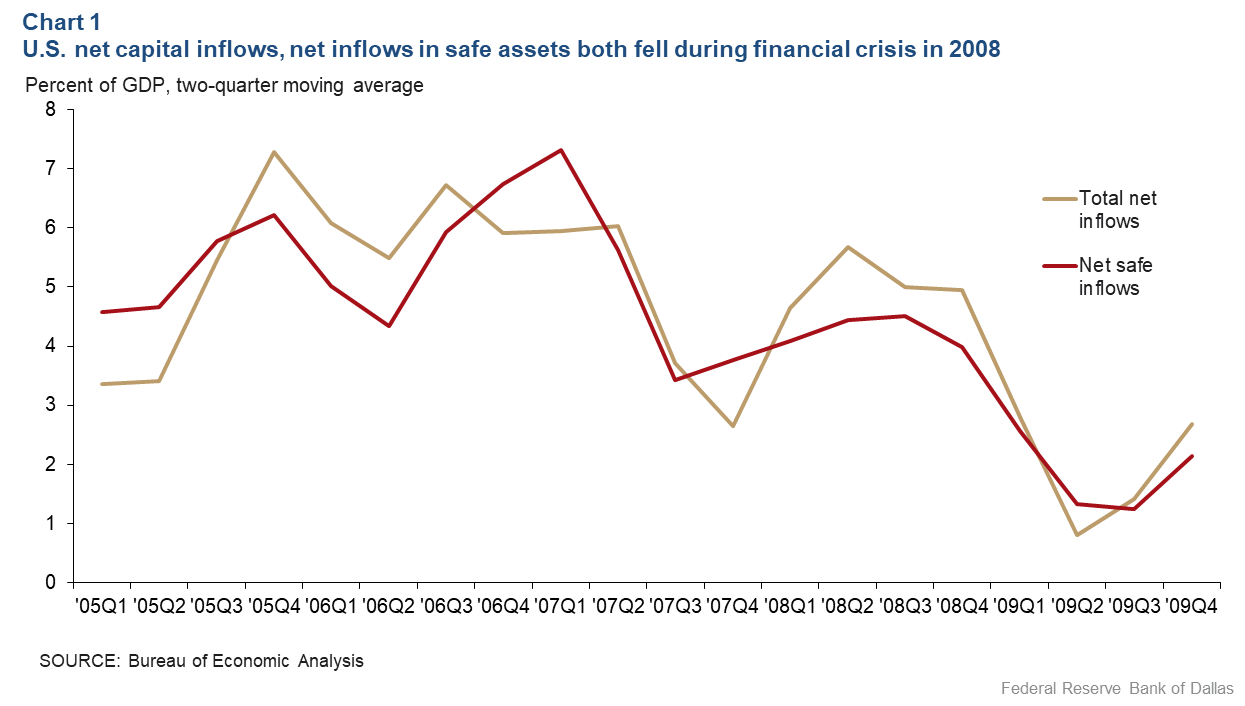
U.S. total net inflows went from around 6 percent of GDP in 2006 to about 3 percent by 2009, a sizable current-account reversal. The decline in net inflows of safe assets was even greater, as net safe flows fell from 7 percent of GDP on the eve of the global financial crisis to 2 percent by the trough.
This strong current account reversal during a crisis is a textbook example of the exorbitant duty and is a natural outcome of the greater wealth decline during a crisis. But how can the data in Chart 1 and the sharp fall in U.S. net safe inflows be reconciled with flows to U.S. assets during a crisis and the subsequent appreciation in the U.S. dollar.
The two tendencies seem contradictory. The data tell us that U.S. net inflows fall, meaning foreigners bought fewer U.S. assets, the U.S. bought more foreign assets, or both. But the commonly told story of safe haven flows suggests that both foreigners and U.S. agents increase their purchases of U.S. assets.
All Treasuries are not created equal
Both long-term Treasury bonds and short-term Treasury bills are widely considered safe assets and have no default risk; it is common in the international finance literature to discuss how these U.S. safe assets provide their holders with an extra safety benefit. That benefit leads to a higher demand, and thus, a higher price and a lower yield. The negative spread between the yield on U.S. safe assets and comparable assets from other developed economies is referred to as a “convenience yield.”
But not all Treasury securities are equally safe. Long-term Treasury bonds may have no default risk, but they have liquidity risk and interest rate risk—when selling the bond prior to maturity, the sales price is sometimes uncertain, especially in times financial market stress. (Generally, Treasury prices move inversely to interest rate changes.)
Short-term Treasury bills are also default-risk free and relative to Treasury bonds carry little liquidity or interest rate risk. In a crisis, when investors prize safety and liquidity, they flock to safe short-term T-bills. This is what we see in Chart 2, which plots short- and long-term portfolio debt inflows over roughly the past two decades.
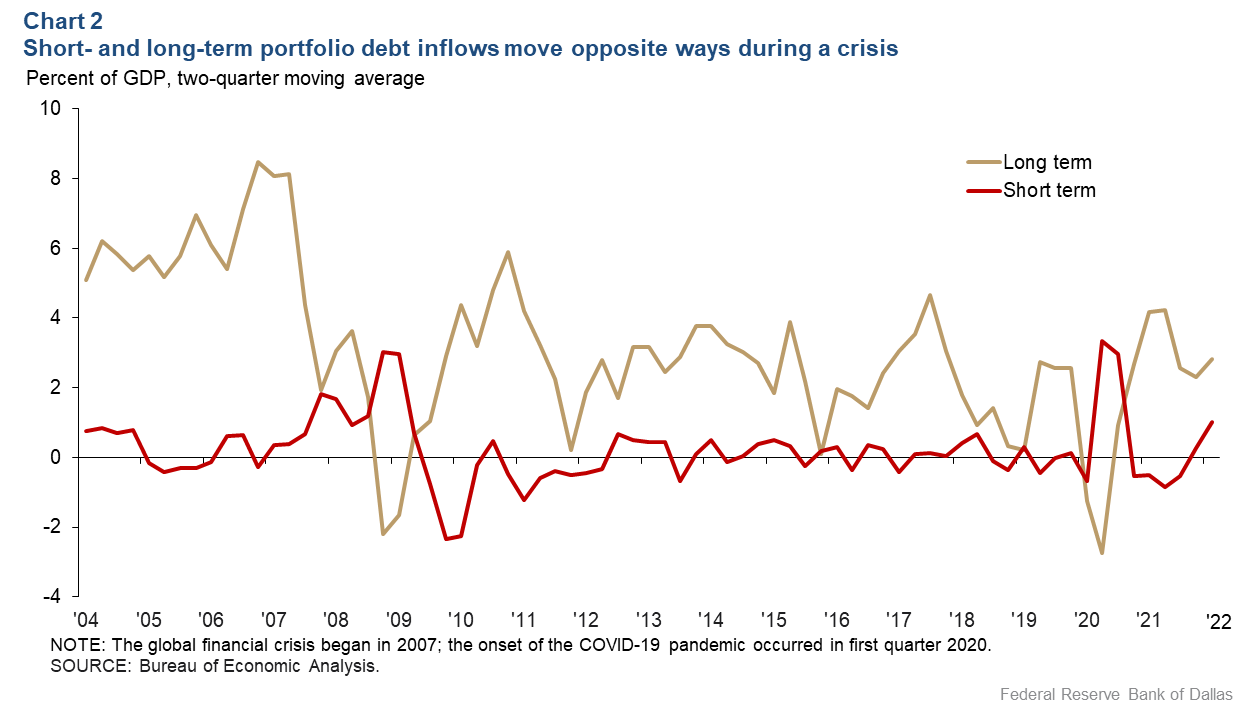
Recall that these inflows are the purchases of U.S. assets by foreign investors. In the two large crises in this sample period, the 2007–09 global financial crisis and the onset of COVID-19 in early 2020, long-term U.S. portfolio debt inflows fell but short-term portfolio debt inflows increased.
A decline in long-term portfolio debt inflows during a crisis is not surprising, and the retrenchment of gross capital inflows and outflows during a crisis is well-documented. However, short-term portfolio debt inflows move in an opposite manner: There is a sharp increase in short-term portfolio debt inflows during a crisis. In the 2007–09 crisis, this increase began in 2007 and accelerated in late 2008. During the COVID-19 crisis, this increase occurred much more suddenly in early 2020.
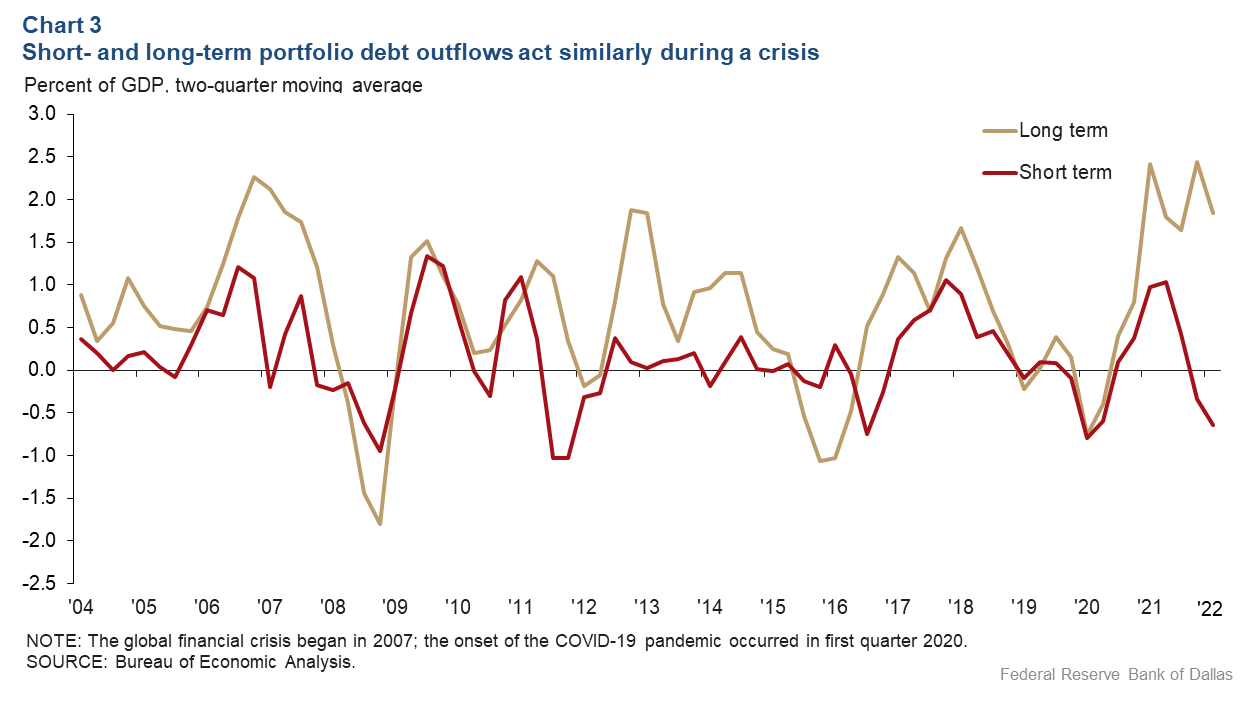
This behavior of long- and short-term U.S. portfolio debt inflows contrasts with U.S. portfolio debt outflows (Chart 3). Recall that outflows are U.S. purchases of foreign portfolio debt assets. Here, short- and long-term flows move in the same direction, and there is a sharp retrenchment in both during a crisis—whether it be the 2007–09 crisis or the COVID-19 onset.
Both short- and long-term outflows and long-term inflows follow the usual pattern of retrenchment in a crisis. But short-term U.S. inflows are different. In a crisis, when demand falls for foreign assets and there is a global capital flow retrenchment, demand for U.S. short-term safe assets increases.
Moving beyond the global financial crisis and COVID-19 onset, we can look at the correlation between U.S. capital flows and a measure of market risk over the entire sample period. Market risk can be proxied by the VIX index, a measure of the implied volatility on S&P 500 options. When the VIX is high, market risk and risk aversion are high, and vice versa.
Chart 4 plots the correlation between different components of U.S. capital flows and the VIX. A positive correlation means the component of U.S. capital flows increases when risk or risk aversion increases, and a negative correlation means it decreases.
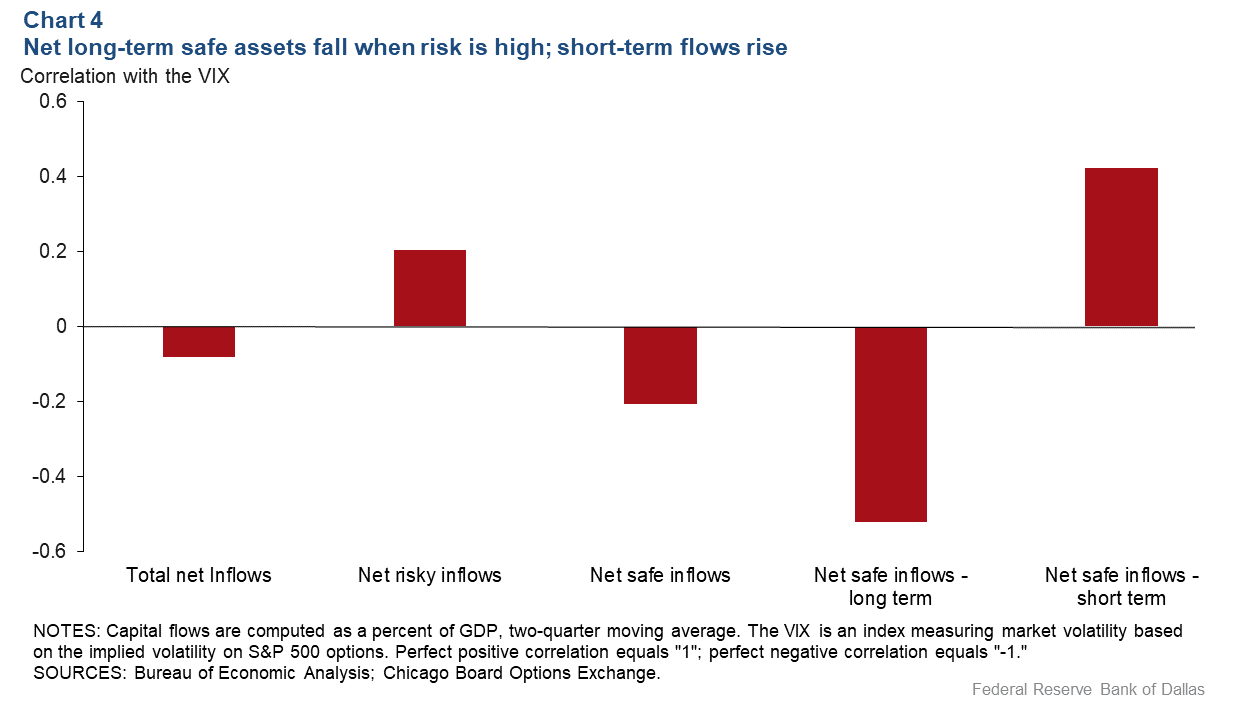
We can see that U.S. total net inflows and net safe-asset inflows decrease when risk is high, but net risky asset inflows increase. This is a consequence of the “exorbitant duty” and the fall in relative U.S. wealth when risky asset prices fall.
Meanwhile, total net safe flows fall when risk is high—as would be expected—but the breakdown of total net safe flows into long- and short-term flows show that long-term net flows fall when risk is high, but short-term net safe flows increase. So, the negative correlation between U.S. net safe-asset flows and the VIX arises because long-term flows decline more than short-term flows rise.
Resolving the contradiction
Earlier I pointed out the apparent contradiction between the fall in U.S. net capital inflows—especially net inflows in safe assets—observed in a crisis, and the discussion of safe haven flows into U.S. safe assets during a crisis.
While this article does not focus on exchange rates, this contradiction lies at the heart of the reserve currency paradox. By providing the world’s safe assets, the U.S. has a large net external debt and, thus, faces a greater wealth decline during a crisis. That should depreciate the dollar, and yet in a crisis we observe significant dollar appreciation.
By looking not only at U.S. safe-asset flows, but also at short- and long-term safe-asset flows, we see the resolution of this contradiction. During a crisis, U.S. net safe-asset inflows decrease, as we would expect given the U.S. net-foreign-asset position.
But this decrease in total safe-asset inflows happens because of a larger decrease in long-term safe-asset inflows. Short-term U.S. safe assets are the assets that are truly safe, and safe haven flows lead to an increase in these short-term inflows, even while long-term inflows fall.
About the Author

Scott Davis
Davis is an economic policy advisor and senior economist in the Research Department at the Federal Reserve Bank of Dallas.
The views expressed are those of the author and should not be attributed to the Federal Reserve Bank of Dallas or the Federal Reserve System.