Rising unemployment does not mean recession is inevitable
The U.S. unemployment rate has increased gradually over the past year, from a three-month average of 3.7 percent in September 2023 to 4.2 percent in September 2024. Historically, that sort of increase is a reliable predictor of recession. According to the Sahm Rule, when the three-month average unemployment rate rises more than a half percentage point from the minimum rate over 12 months, a recession is likely, followed by larger unemployment increases.
Yet, forecasters currently expect only a modest increase in unemployment with no recession. Is this a reasonable expectation, and if so, how is this unemployment episode different from others? Currently, GDP growth remains solid, the number of monthly layoffs is stable, and household wealth is increasing, separating this rise in unemployment from similar increases in the past that accurately signaled recession.
Accurate signals versus false alarms
Chart 1 plots the increase in unemployment from the previous 12-month minimum, as the unemployment data appeared at the time of initial release before revision.
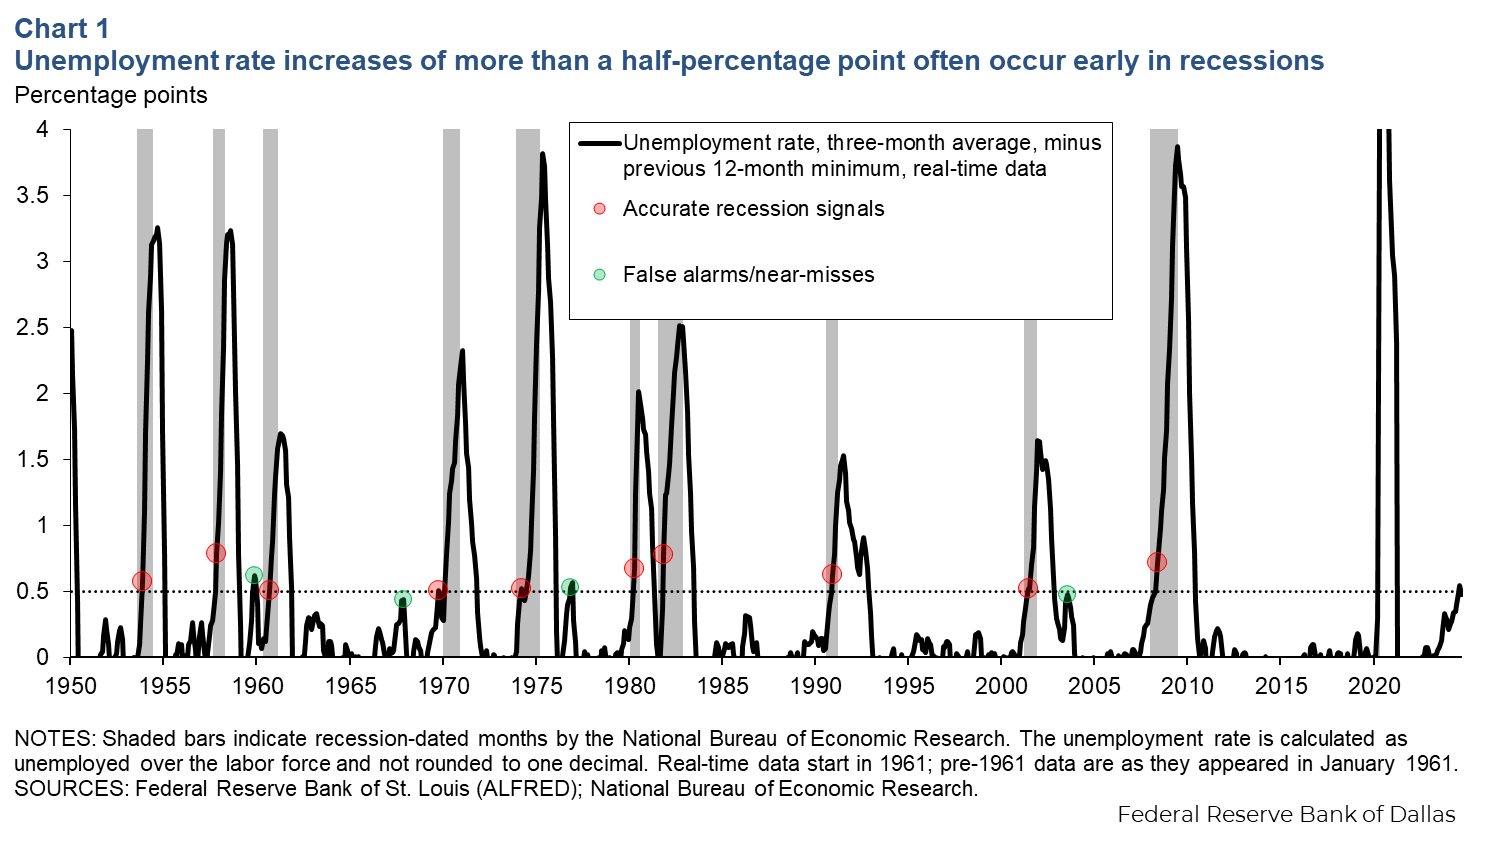
The red circles indicate the months when the indicator first exceeded the 0.50 percent threshold and a recession soon followed or had already started. The green circles indicate episodes when the threshold was crossed (November 1959 and November 1976) or nearly crossed (October 1967 and July 2003) without a recession or further sharp increase in unemployment.
Other indicators may corroborate the signal
There is little fundamentally different about the labor market when the unemployment rate has increased 0.49 percentage points compared with an increase of 0.51 percentage points. Other economic indicators, apart from this specific unemployment threshold, should more reliably signal whether an unemployment rise is likely to snowball into a much larger increase.
Job growth is an obvious candidate, but it would have been misleading in several of these episodes. Through the first several months of the 1970 and 1974 recessions, job growth remained positive despite rising unemployment, driven by strong labor supply growth and an increasing labor force participation rate for women. In the other direction, the number of jobs contracted in 1959 and in 2003, but no recession occurred.
Output growth slowed at the same time as accurate signals
The left panel of Chart 2 plots two-quarter real GDP growth around the time of the recessionary increases in unemployment, with 0 on the horizontal axis corresponding to the quarter the unemployment threshold was exceeded.
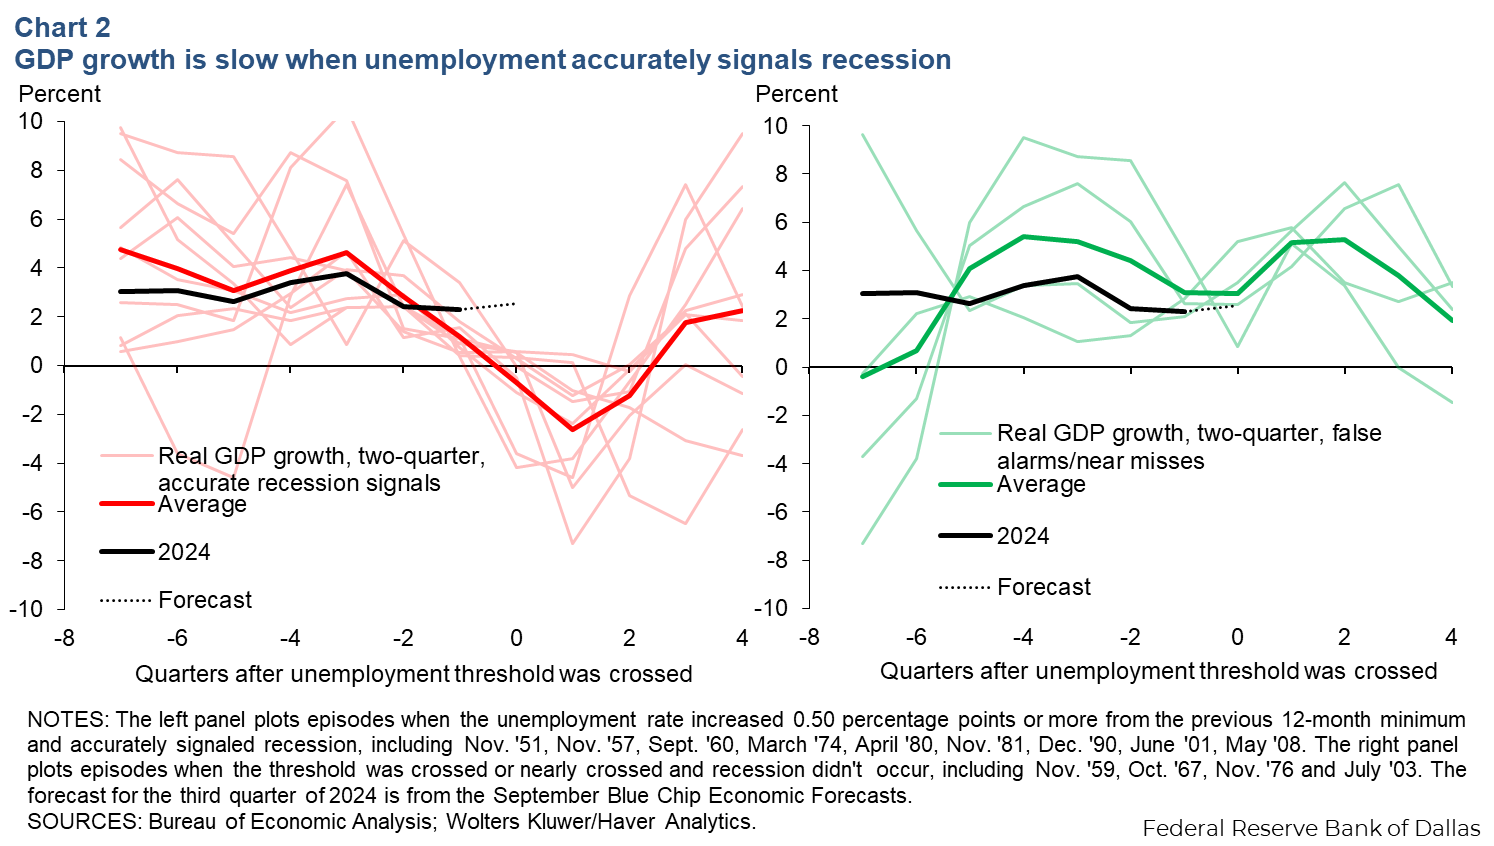
In every recession episode, two-quarter GDP growth slowed to near zero or GDP contracted in the quarter that the threshold was exceeded. The right panel shows that in the false alarm or near-miss episodes, economic output continued to expand at solid or strong paces.
This may seem trivial—by definition, recessions exhibit a contraction in economic activity—but the timing is important. If unemployment crossing the half-percentage-point threshold were an early warning sign later followed by recession, the left chart would show solid growth through period 0 that falls off in later periods.
Rather, the chart shows that during recessions, half-percentage-point unemployment increases coincided with slower output growth or occurred afterward—providing no early warning sign. If GDP growth for the third quarter of 2024 comes in around 2 percent, as forecasters expect, it would be notably different from the episodes followed by sharply higher unemployment.
What could have been known at the time?
The data in Chart 2 would not have been available at the time the unemployment data were released. GDP data come out with a lag and can be heavily revised, especially around business cycle turning points. Were forecasters optimistic as they are now at the time of other unemployment rate increases, but the GDP data later disappointed and were revised downward?
Chart 3 repeats the exercise but only with GDP and gross national product data that would have been available at the time of the unemployment rate releases. The paths of output growth for the contemporaneous quarters and beyond are extended with what forecasters expected at the time, limiting the episodes to 1969 and after.
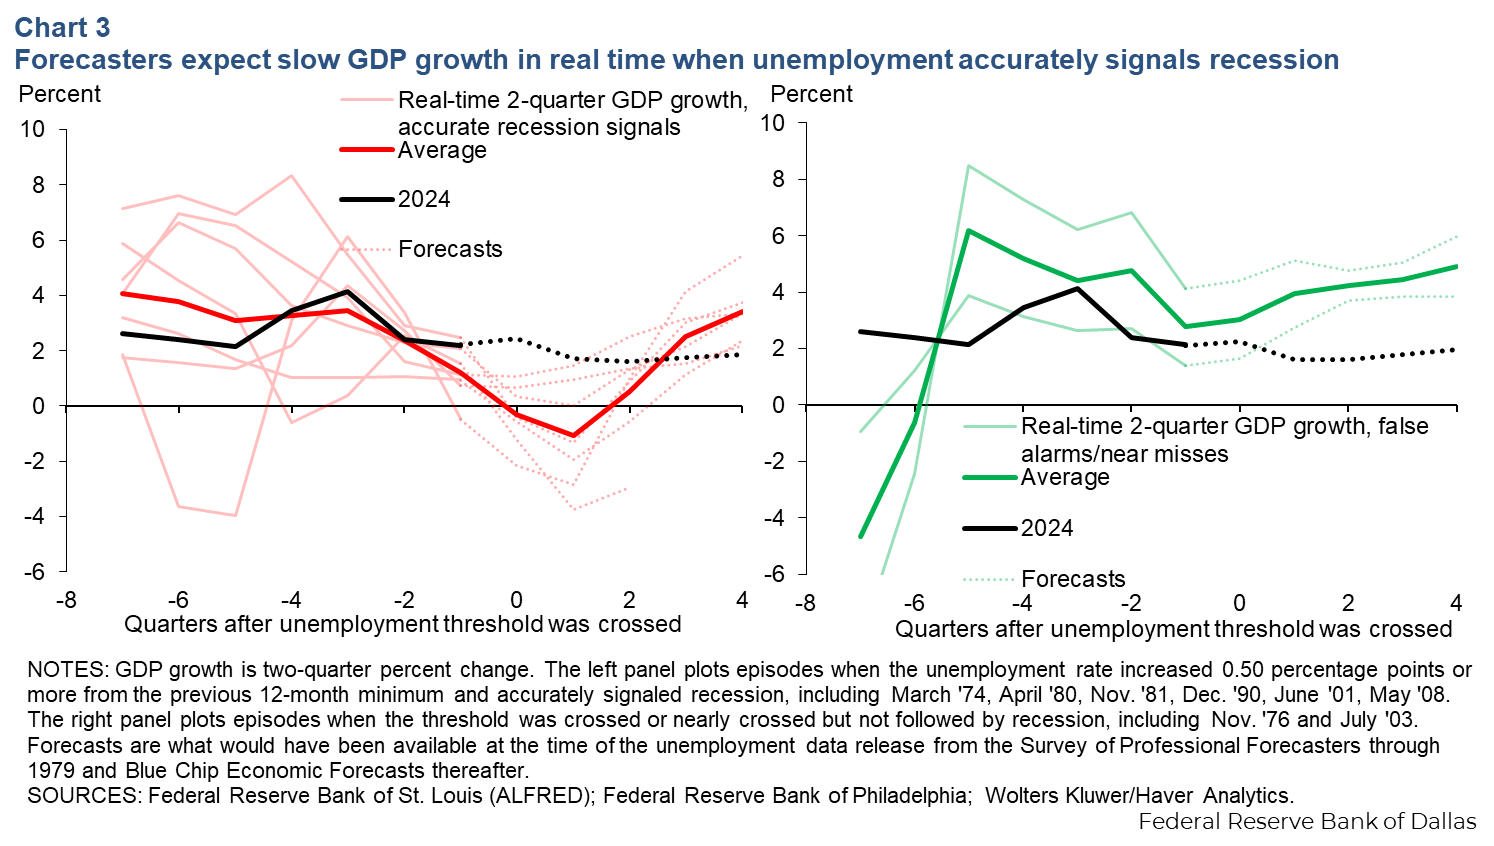
In the recessionary episodes, growth had already slowed or was expected to slow to 1 percent or lower when unemployment growth hit the 0.5 percent threshold, and often expectations were for economic contraction. Currently, forecasters expect around 2 percent GDP growth. This episode appears different, even limited to information available at the time.
What else is different about this increase?
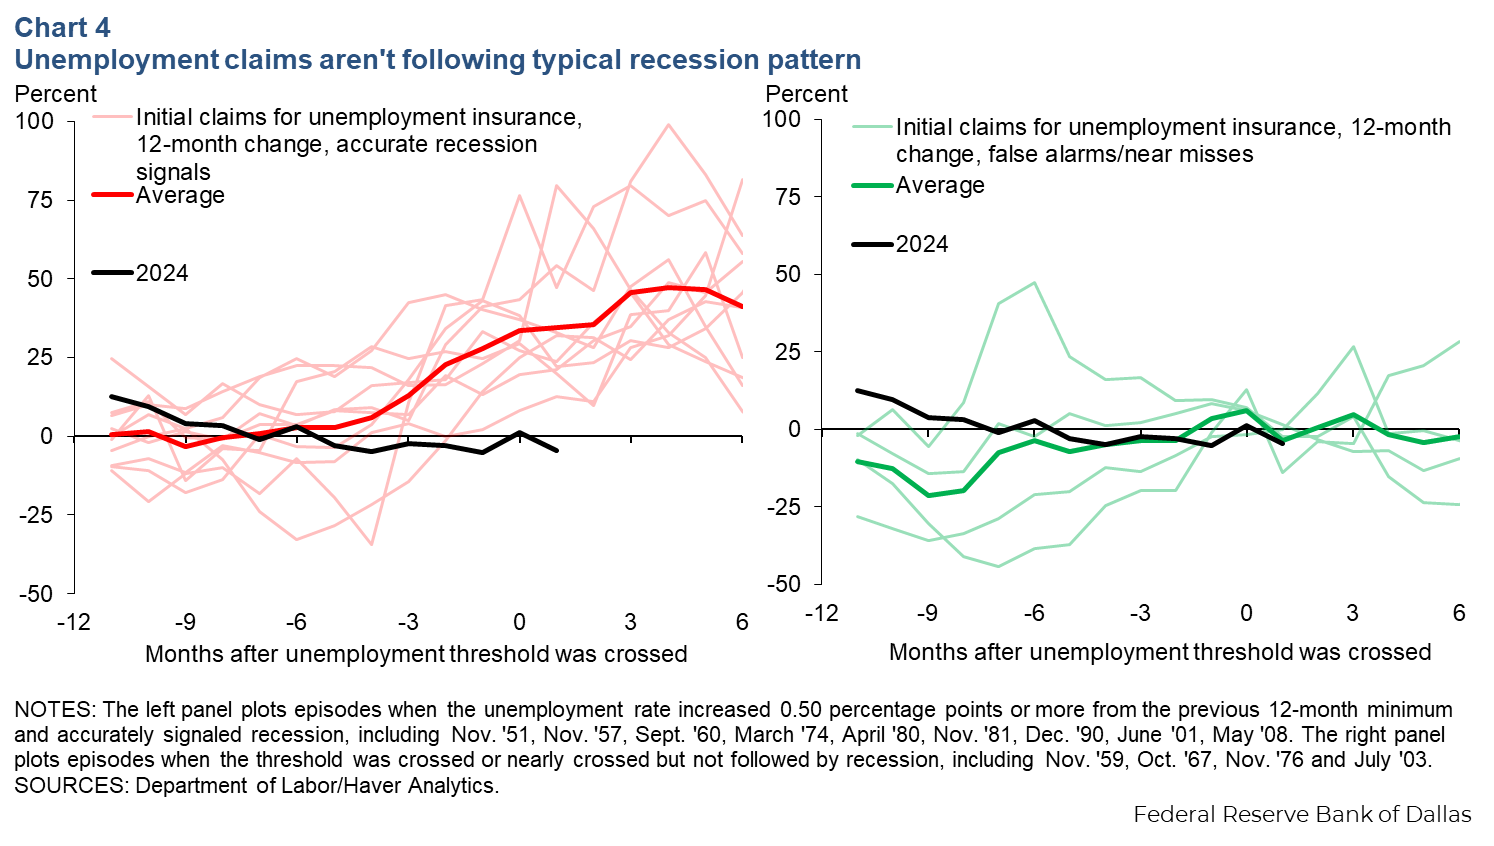
Another unusual feature of the current economic environment: While unemployment has risen, many measures of layoffs have remained stable at low levels. This implies that slow hiring is playing a larger-than-usual role in the increasing unemployment rate. Chart 4 repeats the exercise for the year-over-year change in initial claims for unemployment insurance. In all of the recessionary episodes, layoffs (proxied by unemployment insurance claims) rose notably. In the false alarm and near-miss episodes, claims were roughly steady over the last year, similar to the current data.
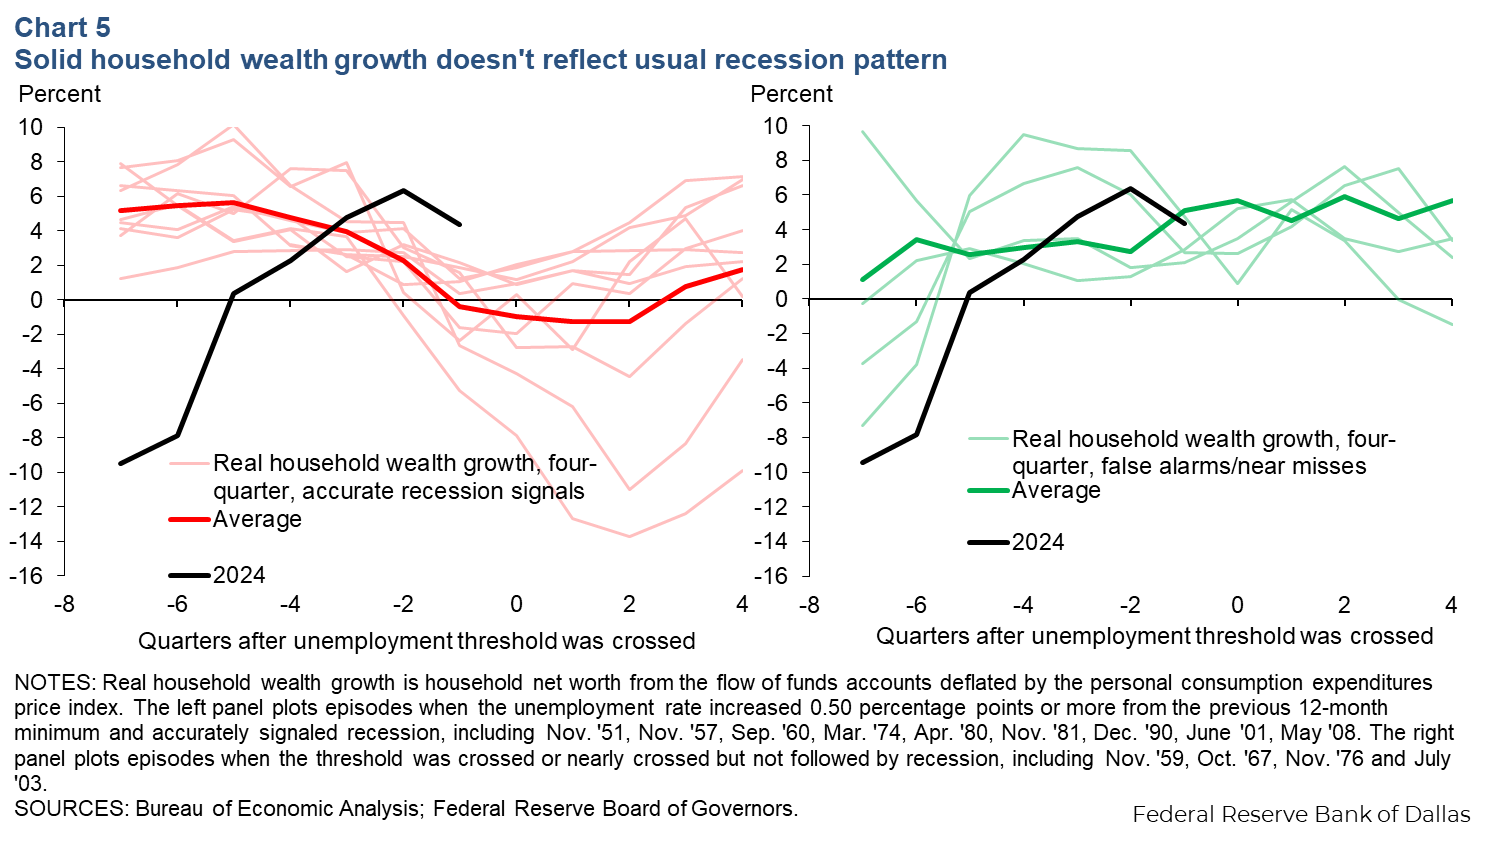
Another notable feature of the current economic environment is that household balance sheets are healthy, and asset values are increasing. Chart 5 shows year-over-year real household wealth growth in the different episodes. When the unemployment increase accurately signaled a recession, wealth increased slowly or even contracted. In the false alarm and near-miss episodes, wealth grew at a healthy pace, similar to the current data.
For now, conditions appear different than recession episodes
How is the recent unemployment rate increase different from those that accurately signaled recessions? This time, unemployment has risen amid apparently ample GDP growth, stable layoffs and growing real household wealth. It is then reasonable, although certainly not guaranteed, to expect only modest further increases in unemployment, as most forecasters project.
A spike in the unemployment rate is not inevitable after already increasing a half percentage point. However this threshold rule captures the typical nonlinear behavior of unemployment: Periods of stability or gradual drifts higher, as forecasters currently expect, are historically rare.
The fact that the signal is contemporaneous rather than leading reflects another aspect of economic forecasting: Recessions are very difficult to predict. If these corroborating indicators were to turn and no longer appear reassuring, a recession is likely to have already begun.
About the author


