
More household savings offset increased government borrowing since 2008
Foreigners owned one-third of U.S. government debt at the turn of the century. The share rose to more than half by 2008.
Since then, despite a wave of government borrowing, the foreign share fell to 30 percent in 2023, a nearly three-decade low. Increased U.S. household saving appears to account for the shift in who holds the obligations of the federal government. It also helps explain why the U.S. net external debt position has been relatively stable even as government debt has grown.
The U.S. net foreign asset position measures the value of foreign assets held by U.S. residents minus the value of U.S. assets owned by foreign residents. The U.S. net foreign asset position has weakened since 2007, mostly due to deterioration in the net position in equity assets, I noted in a previous article. The change in the net equity position is entirely due to valuation effects; U.S. equity markets’ recent strong performance has raised the value of U.S. equity liabilities.
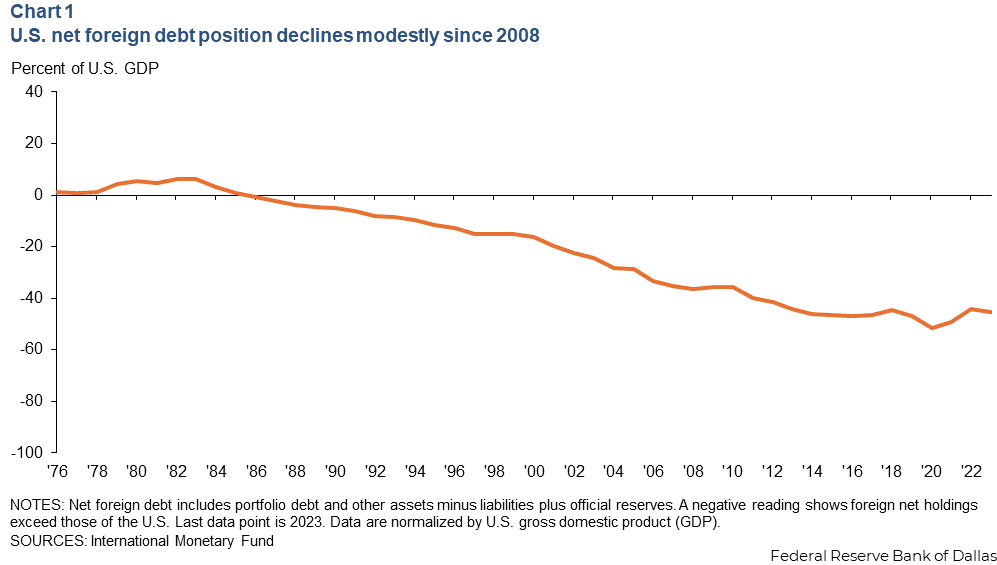
Meanwhile, the U.S. net foreign asset position in debt assets is driven by changes in external borrowing and only modestly deteriorated over the past 15 years (Chart 1). The U.S. net foreign debt position fell from around -35 percent of GDP in 2007 to -45 percent of GDP in 2023. (Negative percentages indicate greater holdings by foreign residents of U.S. assets than U.S. residents of foreign assets.) This decline of 10 percentage points over 16 years comes after a much more rapid fall of 20 percentage points in the eight years from 1999 through 2007.
The net foreign asset position can be further divided into gross foreign assets (the value of foreign debt held by U.S. residents) and gross foreign liabilities (the value of U.S. debt held by foreigners). There was a dramatic increase in both positions, especially the gross liability position, from 2000 through 2007. Gross foreign debt liabilities increased 40 percentage points, and gross foreign debt assets rose 20 percentage points. (Chart 2)
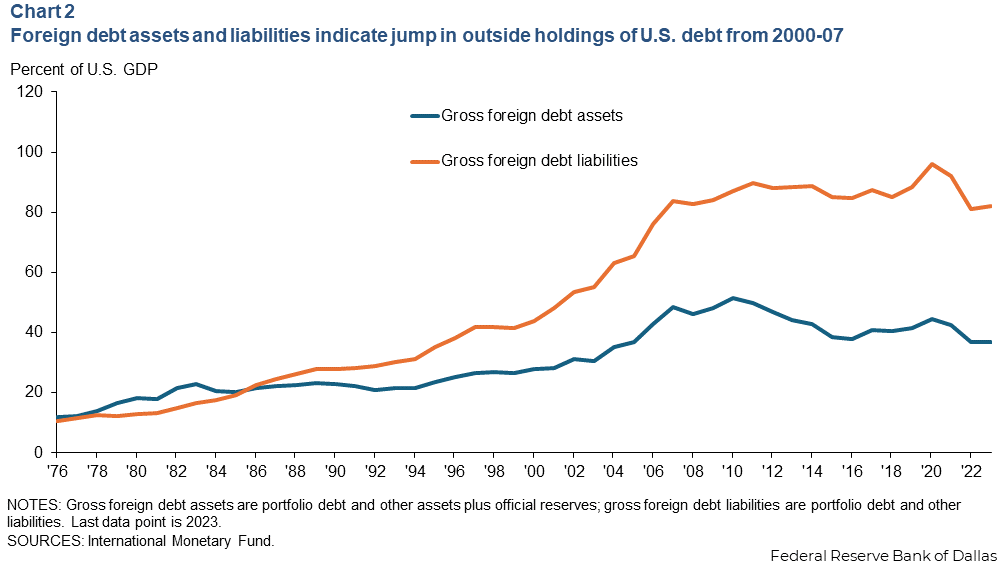
However, both gross positions have been fairly stable since 2007. Since then, there has been no change in the gross foreign debt liabilities and a 10-percentage-point fall in the gross foreign debt assets.
The economics literature shows that the net foreign asset position in debt assets—not in equity assets—affects a country’s macroeconomic and financial stability. In empirical work, Luis A.V. Catão and Gian Maria Milesi-Ferretti (2014) examine the determinates of currency crises in emerging markets. They find that a negative foreign asset position in debt assets is a significant crisis predictor. They also find that the net foreign asset position in equity assets plays no role in predicting a crisis, and in some cases a negative net equity position makes a crisis less likely.
Pierre-Olivier Gourinchas and Maurice Obstfeld (2012) explain why external debt liabilities affect financial stability while external equity liabilities do not. “Because equity claims do not entail a fixed payment stream, and are junior to debt claims, they do not threaten a country with external illiquidity or insolvency,” the economists write.
Breaking down the U.S. foreign debt position by sector
While changes in the net foreign equity position are largely driven by changes in the relative values of U.S. and foreign equities, changes in the net foreign debt position are a function of net national borrowing and saving.
Chart 3 plots U.S. net national savings and the breakdown into net savings by U.S. households, businesses and government (including the Federal Reserve). Net national savings is also known as the current account.
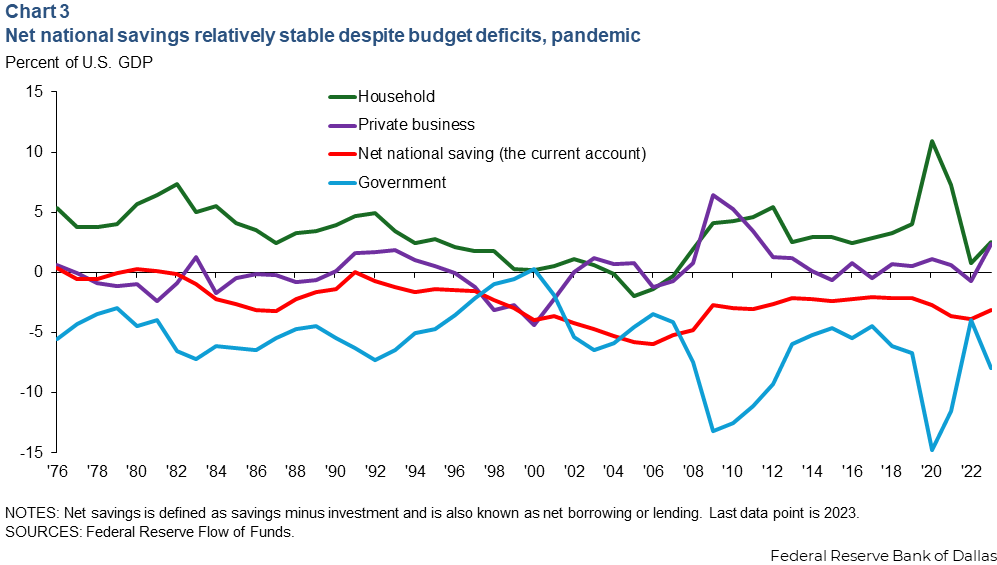
Since the 2008 Global Financial Crisis, net national savings has been negative but relatively stable at around -3 percent of GDP. This stability in U.S. net national savings occurred despite large declines in government net savings (amid a large federal deficit) in 2008 and again in 2020 (with the pandemic). During those episodes, net savings by households and private businesses rose, offsetting the decline in government savings.
From 2000 through 2007, a large deterioration in the U.S. net debt position occurred. This was a time when U.S. net national savings declined, reaching about -6 percent of GDP just before 2008. During this period, government savings fell with the simultaneous decline in household saving. Household net savings actually turned negative from 2004 through 2007.
The net debt position largely reflects the cumulative sum of past net savings. The change in the net debt position since 1976 of the U.S. firm, household and government sectors is plotted in Chart 4. The net debt position in these three sectors would sum to the net foreign debt position plotted in Chart 1 (apart from a small statistical discrepancy).
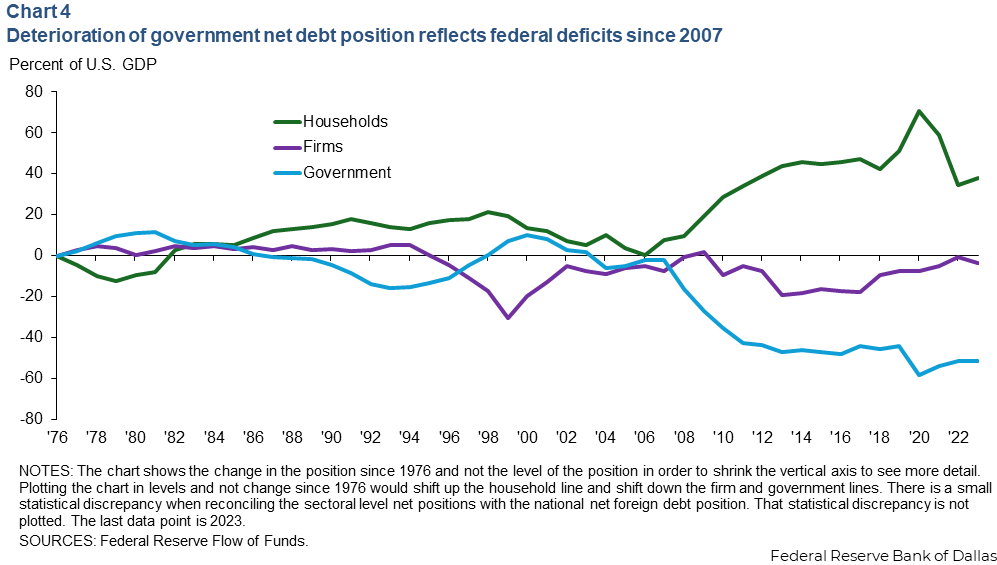
The chart shows the deterioration in the government net debt position since 2007, reflecting large government budget deficits. However, this deterioration in the government’s net debt position was matched by an improvement in the households’ net debt position.
Since 2007, the net debt position of the government sector has deteriorated by about 50 percentage points of GDP, but the net debt position of the household sector has improved by about 40 percentage points. As a result, the net foreign debt position has deteriorated by around 10 percentage points of GDP.
Foreign holdings of Treasuries have fallen
Chart 5 plots the total value of Treasuries outstanding, excluding those held by the Federal Reserve or by state and local governments, and the value of foreign holdings of Treasuries.
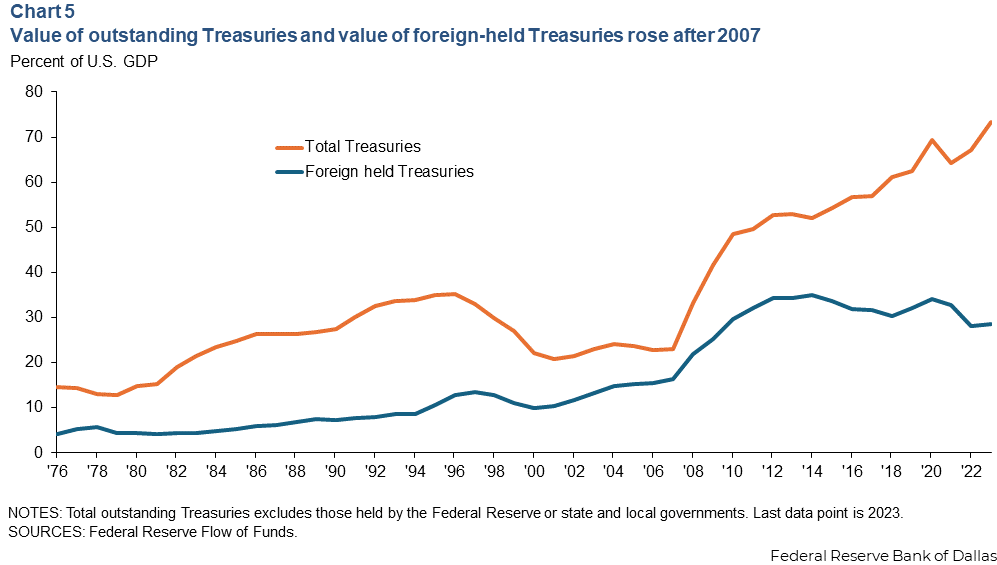
Since 2008, the value of Treasuries outstanding has gone from 22 percent of GDP to 73 percent. However, the value of foreign held Treasuries has risen from 16 percent to 28 percent of GDP (all of the increase occurred from 2008 through 2014). Since 2014, foreign holdings of Treasuries as a share of GDP have fallen.
The share of outstanding Treasuries held by foreign buyers—the ratio of the blue line to the orange line in Chart 5—was 34 percent in the year 2000. The government issued more debt from 2000 through 2008, but foreigners bought much it, given the low domestic savings rate. Consequently, the foreign-owned share rose to 53 percent. However, since 2008 the share of outstanding Treasuries held by foreign buyers has fallen and was 30 percent in 2023, the lowest level since the mid-1990s.
Large government budget deficits over the past 15 years have led to a large increase in the stock of government debt. The level of government debt has risen by about 50 percentage points of GDP. But these government deficits have been matched by an increase in U.S. household savings. The household net debt position has improved by around 40 percentage points of GDP over the period. The result has been a more modest increase in total U.S. net borrowing from the rest of the world.
About the author


