
Rising unemployment doesn’t counter signs of strong GDP growth
Real (inflation-adjusted) GDP grew strongly during the second and third quarters of 2024, increasing at an annualized pace of 2.9 percent. Yet, the unemployment rate also rose 0.4 percentage points, an unusually large amount except during recessions.
Some analysts have noted a tendency for downward revisions of GDP growth heading into a recession. They argue for greater emphasis on labor market indicators when assessing cyclical strength.
However, we find that even taking into account recently rising unemployment, it is highly unlikely that GDP growth will be revised to zero or even turn negative.
Initial GDP estimates were subsequently trimmed during the early stages of recessions in third quarter 1990, second quarter 2001 and second quarter 2008 (Chart 1).
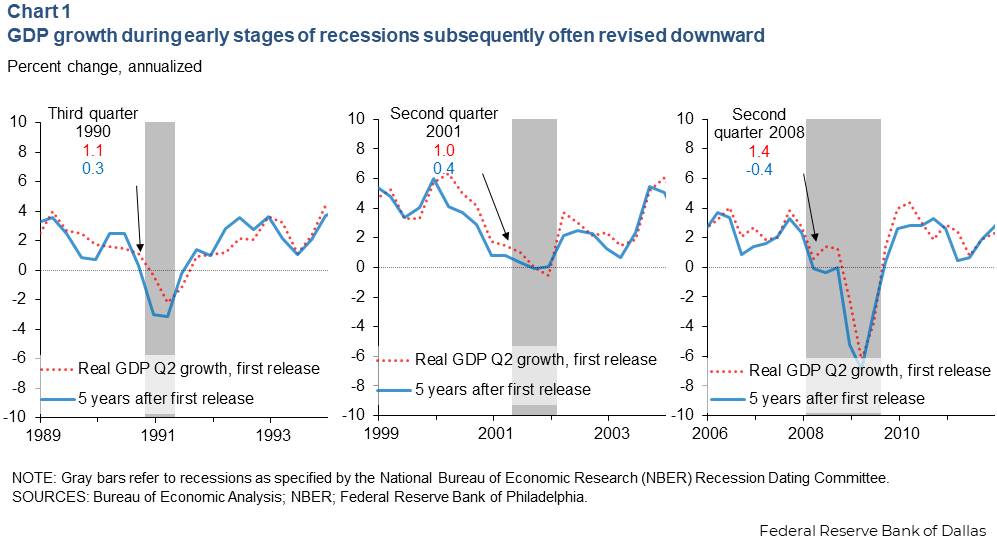
The two-quarter annualized growth around the 1990, 2001 and 2008 recessions are plotted to depict the change from the initial release and to the value five years later. We use two-quarter average growth to smooth volatility effects. Furthermore, episodes of negative two-quarter average GDP growth—in other words, contracting output over half a year—generally, line up with recessions defined by the National Bureau of Economic Research Business Cycle Dating Committee.
GDP revisions aren’t a one-and-done process. After each quarter’s initial estimate, GDP is revised in the two following months and then annually during the subsequent five years. Occasional comprehensive revisions to GDP methodology also alter the entire history. For example, in the 2024 annual revision, the level of GDP increased 1.3 percent due to incorporation of more comprehensive but lagging source data for consumer spending, nonresidential fixed investment and residential fixed investment.
Revisions can be particularly impactful around business-cycle turning points, potentially changing the characterization of economic conditions from expansion to contraction. In the highlighted quarters in Chart 1, two-quarter growth was initially reported at between 1.0 and 1.5 percent; five years later, nearly all of that growth was revised away, as the economy turned out to be on the verge of, or had already fallen, into a recession. Moreover, in each of these episodes, the unemployment rate had also increased around 0.4 percentage points, potentially providing a more reliable signal of economic momentum.
Can changes in unemployment predict GDP revisions?
To assess the probability that current data might be similarly revised, we utilize quantile regressions. This statistical tool predicts the distribution of revisions to GDP growth based on the two-quarter change in the unemployment rate. This methodology is similar to other studies that estimate a distribution of anticipated GDP growth based on financial conditions.
This method predicts the average size of revision that can be expected but also allows for rising unemployment to imply increased downside risk. After all, recessions are not an everyday event and are difficult to predict. Even if large negative revisions to GDP are not the most likely outcome, it would be useful to know if the risk of a tail event is heightened.
Chart 2 shows the results of this exercise. The median expected revision of output for the third quarter is a reduction of 0.2 percentage points, with 50 percent probability of revisions being within 1 percentage point and 90 percent within 2 percentage points of the original figure.
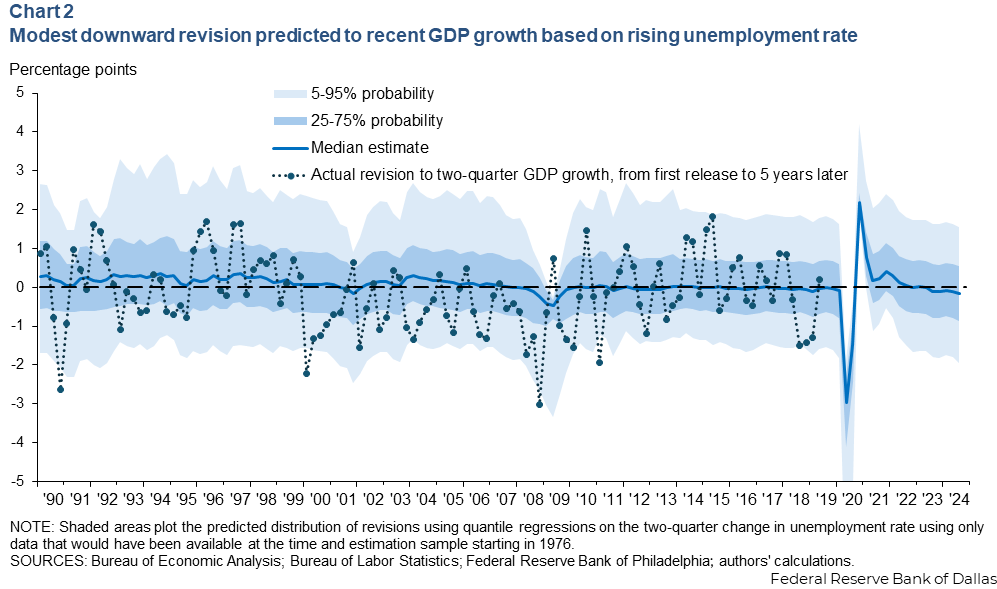
This indicates that while rising unemployment likely implies downward revisions to GDP, the scale is modest, and there is little indication of heightened downside risk for a more negatively skewed distribution. This reflects that the relationship between rising unemployment and GDP revisions is generally weak, despite the three episodes highlighted in Chart 1. It is not unusual for GDP growth to be revised down during expansions or up in recessions.
Chart 3 plots the implied distribution of GDP growth after five years of revision for the three example episodes as well as the most recent data. This is the initial release of GDP growth plus the estimated distribution of revisions from Chart 2, allowing for changes in the location and shape of the distribution based on unemployment.
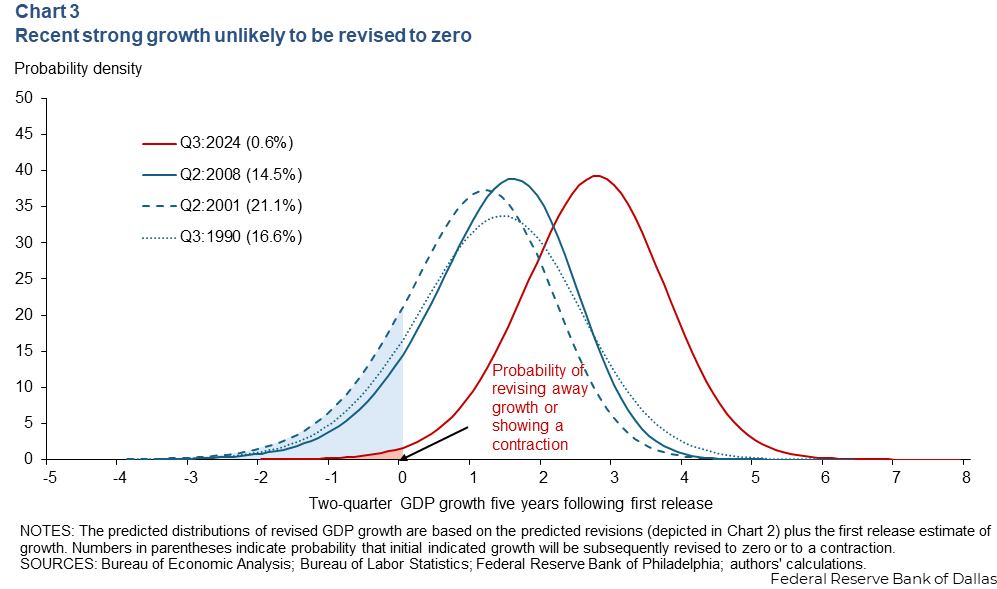
The probability that growth will be revised away is shown by the area of the curve sitting on 0 on the horizontal axis or at a point less than 0. In the three highlighted episodes heading into recession, there was a meaningful estimated probability—15 to 21 percent—that growth would be revised down to near zero. In contrast, the estimate for the last two quarters is below 1 percent. Notably, in those episodes, growth had already considerably slowed to below trend and, therefore, only a small revision was needed to bring it to zero.
Current GDP growth most likely reflects reality
GDP is often revised downward in the early stages of a recession when the labor market is weakening. One approach is to entirely focus on labor market signals and put no weight on the signal from GDP in assessing economic momentum.
Alternatively, this exercise quantifies what GDP is likely to look like in hindsight, based on the historical relationship between revisions and unemployment. While revisions will occur, it’s highly unlikely that current growth will be revised away to near zero because of the strength of initial growth estimates.
About the authors

Tyler Atkinson is a senior business economist in the Research Department of the Federal Reserve Bank of Dallas.

Prithvi Kalkunte is an economic programmer in the Research Department at the Federal Reserve Bank of Dallas.