
Renewable energy jobs surge, though data differ on where and by how much
Wind and solar electricity output account for a large and growing portion of power generation, with jobs in those sectors making up an increasing share of energy employment. This rapid growth is challenging traditional methods of measuring that workforce.
Zero-emission energy sources, wind, solar, hydroelectric and nuclear, accounted for more than 40 percent of U.S. electricity output in 2024, up from 28 percent nearly two decades earlier.
The increase has been so pronounced that the Department of Energy created the United States Energy Employment Report to provide a more comprehensive survey of employment across the energy sector. In the past, the Quarterly Census of Employment and Wages from the Bureau of Labor Statistics (BLS) was the primary source for such information.
These dynamics are important because electricity demand is expected to accelerate over the next decade, driven by growing reliance on generative artificial intelligence, new data centers and increasing electrification—all requiring trained, skilled personnel. Better understanding of the workforce implications of rising electricity demand, particularly at the state and local levels, is critical to planning and anticipating its economic and policy impacts.
Jobs follow sources of energy production
The location of underlying natural resources often determines the location of wind power and hydroelectric production. Most wind energy output, accounting for nearly 50 percent of all renewable electricity, comes from the Great Plains and Midwest. Average wind speeds there are high and relatively steady (Chart 1). Among the states, Texas accounts for the largest share of all U.S. wind power production, about 21 percent.
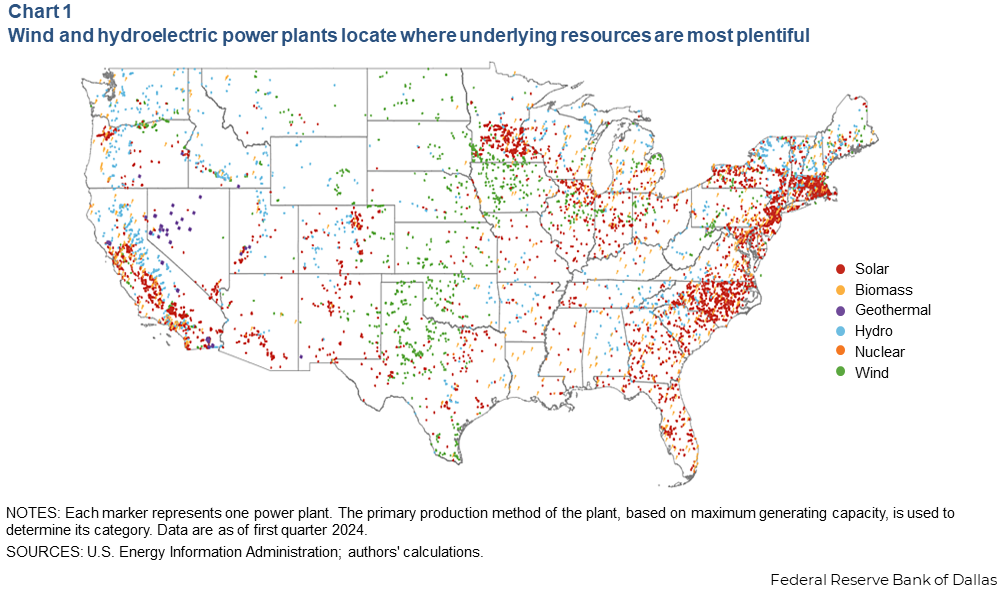
Similarly, topography, river systems, rainfall or snowmelt determine the location of dams and hydroelectric facilities and associated jobs. They are largely in the West. Solar power sector employment does not correlate as clearly with resource availability (Chart 2).
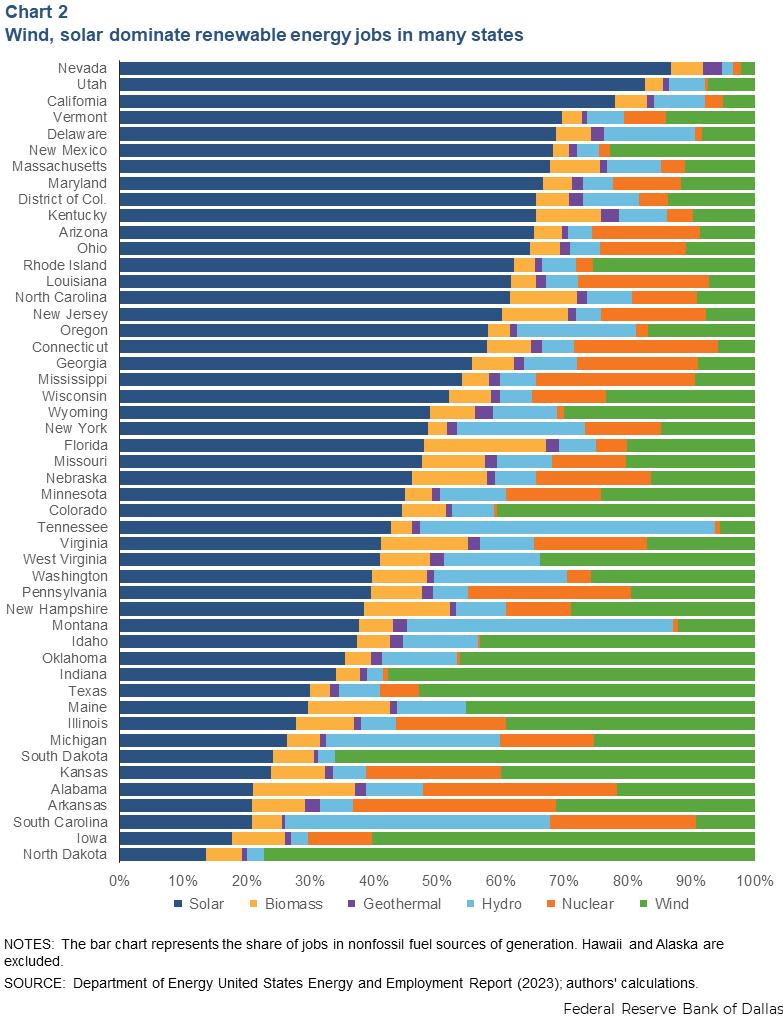
Sunshine (also known as irradiance) favors solar build-out across the Southwest. Varying state government tax credits and standards for renewables have produced pockets of solar capacity in the Midwest and East. Moreover, declining construction and installation costs have accelerated development and sector employment, though not uniformly across the country.
For most states, wind and solar jobs represent a large share of the state’s total renewables jobs, though some states have special profiles, such as Arkansas (largest share of nuclear power jobs).
Energy-generating resources are unevenly spread among states. For example, Texas has high levels of both renewable and nonrenewable energy production. It ranks first in wind production and second in solar production. It is also the nonrenewable energy (oil and gas) center of the country. Given the size and diversity of assets in the state, those resources are not uniformly distributed geographically (Chart 3).
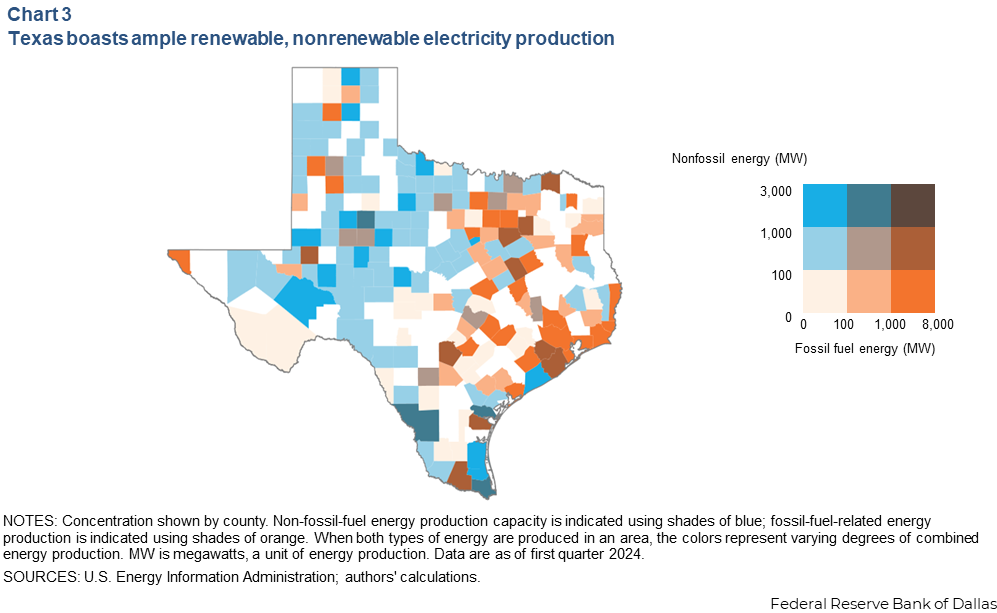
Counties located in the Permian Basin of Texas, the nation’s leading oil-producing region, have historically led fossil fuel power generation, though renewable electricity generation sources are growing quickly.
Data sources measure the renewables labor force
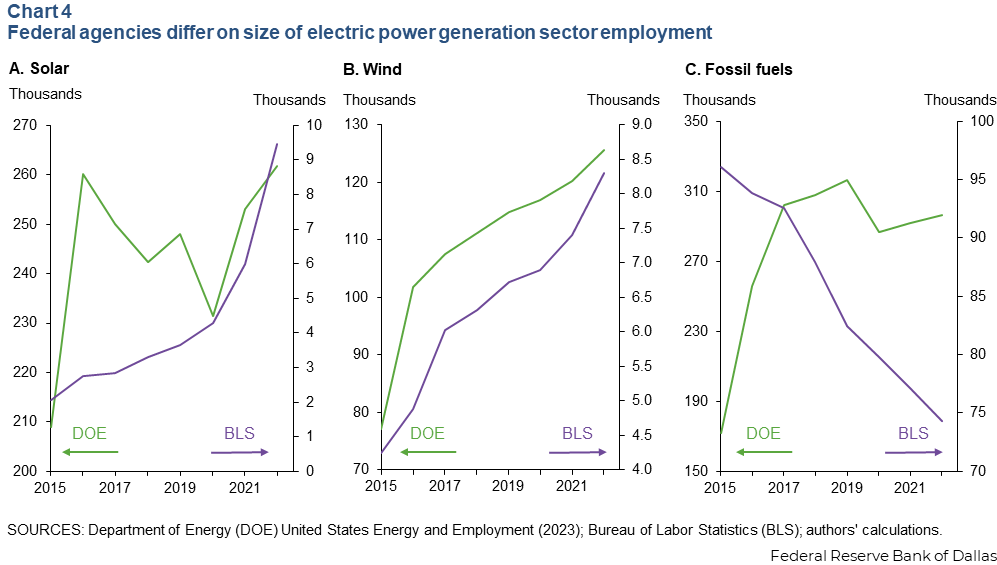
Accurate employment statistics are important for monitoring labor input in the renewable energy industry. The BLS and the Department of Energy, the leading government data sources for energy-related jobs and wages, differ greatly in the magnitude and trend of employment they report. For example, Department of Energy data show the wind industry with 125,000 jobs in 2022 versus the BLS count of only 8,000 (Chart 4).
Three main reasons account for the discrepancies. First, the industry classification system BLS uses was created before many of these new generation methods were widely adopted. Many renewable energy workers are not properly classified as being part of the sector.
This potentially includes tens of thousands of businesses in agriculture, mining and extraction, utilities, construction, manufacturing, wholesale trade, distribution (including pipeline distribution), professional services, and repair and maintenance, according to the Department of Energy employment report. By correcting for these classifications, the department’s compilation engaged 42,100 business establishments in its third-quarter 2023 survey.
Second, nuances about the establishments or the jobs themselves can also lead to misclassification. Many power companies heavily involved with fossil fuel assets also invest in renewables. About 14 percent of the establishments primarily producing fossil fuel energy also generate renewable power. However, the BLS associates each establishment with just one primary industry, omitting many energy producers with diversified generating portfolios that include renewables.
Some jobs can also be hard to capture under the traditional BLS Quarterly Census of Employment and Wages survey methods. For example, many residential solar panel installers work in the HVAC (heating ventilation and air conditioning) industry. In the Energy Department employment report, they are included among solar workers if more than 50 percent of worker time is spent installing solar panels. However, these personnel would not be included in the BLS count for solar workers because they do not work for companies that only install solar panels.
Finally, the Energy Department employment report also counts jobs in industries closely related to power generation. For the BLS, employees of a natural gas power plant design and construction firm would fall into the engineering services classification, not fossil fuel electric power generation.
The Department of Energy employment report seeks to expand upon the BLS count to holistically understand the workforce involved in electricity generation. It could further improve by considering the scope of support labor in each segment of the electricity generating industry. Such a change could lead to slightly lower numbers in future data revisions. For example, the report could provide statistics on jobs by only counting qualifying workers who exceed a minimum work-time threshold—for example, count construction personnel spending more than 30 percent of their time on energy-related project. Still, the department’s current calculation includes a more complete range of jobs within each electricity generating industry than the BLS provides.
Improved data collection crucial to renewable energy labor force
Solar, wind and battery storage capacity lead all forms of electricity generation growth nationwide, especially in Texas. As installation costs have fallen in recent years and various tax credits and other incentives encouraged investment, renewable energy development surged.
Simultaneously, the growing requirements of data centers and related uses will boost demand for baseload electricity generation, sources that, unlike renewables, can serve load at a constant rate. Baseload generation will come in part from new natural gas power plants and perhaps nuclear reactors. New plants and electricity customers will also require more electrical transmission and distribution line construction.
An adequate labor force will be necessary, including more electricians, line workers, HVAC technicians and other trades already confronting persistent and significant staffing shortages. Though employment in these sectors is growing faster than the rest of the labor force, the number of qualified workers hasn’t kept pace.
Nearly 30 percent of electricians are near retirement age, and training and apprenticeships for these jobs can take three to five years. Additionally, these jobs pay higher than average and do not require college degrees. Electrical repair workers and line workers earn median incomes of $71,270 and $92,560 annually, respectively, according to 2024 BLS data.
National, state and local initiatives that raise awareness of these well-paying job opportunities and commit resources toward trade schools, certification programs and streamlined licensing regulations would help prevent a skilled labor shortage that could inhibit meeting electricity demand and the economic opportunities it creates.
About the authors

Garrett Golding is an assistant vice president for energy programs at the Federal Reserve Bank of Dallas.

Claire Jeffress is a former research analyst in the Research Department at the Federal Reserve Bank of Dallas.

Xiaohan Zhang is a senior research economist and Community Engagement and Development research lead at the Federal Reserve Bank of Dallas.