
Fed’s forecasting edge ebbed prepandemic, persisted in downside inflation surprises
Inflation forecasts from before the pandemic, when U.S. prices appeared relatively stable and anchored, provide a useful period for assessing the strengths and the limits of forecasting.
In that era of apparent calm, inflation may have seemed more predictable, yet short-run surprises still mattered for households, firms and policymakers.
We compare Federal Reserve Board staff forecasts from the Tealbook/Greenbook (the Fed’s internal projections) with professional forecasts from Blue Chip Economic Indicators for headline Consumer Price Index (CPI) inflation over the next four quarters.
On average, private forecasts perform about as well as Federal Reserve Board staff forecasts, with meaningful differences mainly regarding how large forecast misses are handled and how relative performance shifts over time. The review underscores both the unavoidable limits of inflation forecasting and the need to guard against overconfidence. This exercise also points to combining forecasts as a practical way to extract more robust signals from imperfect information.
Why revisit inflation forecasting now?
The postpandemic inflation surge was a reminder that inflation can move quickly and remain elevated longer than expected. Over the Federal Reserve’s first century, the U.S. economy experienced repeated bouts of inflation and deflation, from wartime inflations to the Great Inflation of the 1970s and its aftermath.
By contrast, inflation from the mid-1980s through 2019 appears markedly more stable. Inflation fluctuated around relatively low and steady levels, making the pandemic surge stand out (Chart 1).
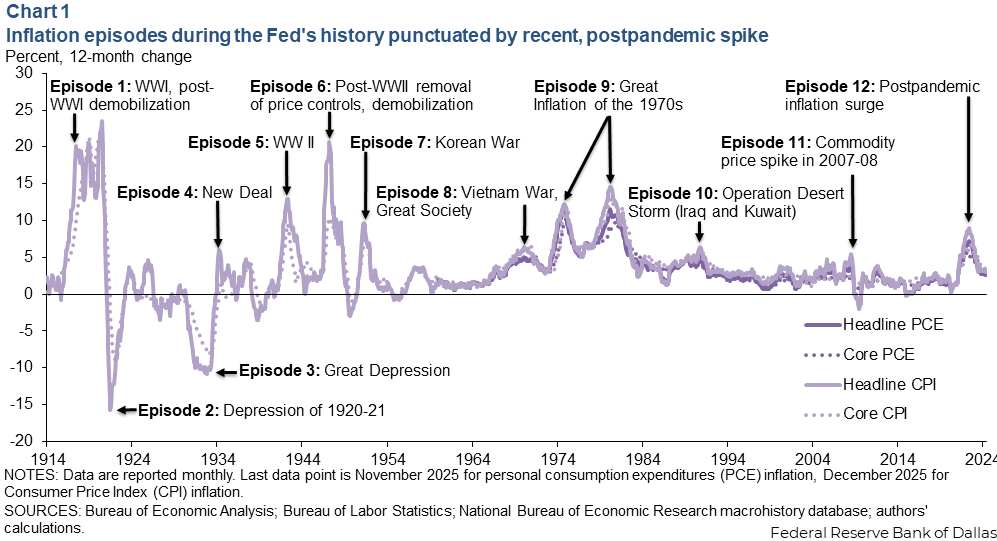
Historical context matters when one thinks about forecasting. When inflation appears stable, it is tempting to view forecasts as less central to decision-making, but that inference goes too far. Even in an anchored-expectations environment, near-term inflation surprises may influence wage setting, pricing decisions and household purchases. Such surprises also remain central for monetary policy by shaping inflation dynamics, real (inflation-adjusted) rates and perceptions of policy credibility.
The relevant question then is not whether inflation forecasts matter—by the way, they do—but rather what their content reveals. Whose forecasts perform better, by how much and along which dimensions? Who prevails even in calm periods rather than just during large, hard-to-anticipate shocks such as the pandemic?
What the literature says about the Fed information advantage
A large empirical literature argues that Federal Reserve staff forecasts embed information not fully reflected in private forecasts. Christina and David Romer articulate this view, showing that staff inflation forecasts were more accurate than private forecasts in earlier periods, with substantially lower mean squared forecast errors—that is, smaller average mistakes.
They argue that staff forecasts can add value by drawing on a broader information set. They also emphasize that the ultimate contribution of staff forecasts depends not only on the projections themselves, but on how policymakers interpret and use them in decision-making.
Related work by Jon Faust and Jonathan Wright reaches a similar conclusion drawing on a different benchmark, comparing Greenbook forecasts with alternatives, using a large real-time dataset synchronized to Greenbook vintages. They revisit—and largely confirm—the view that staff forecasts lie close to the frontier of best performance, albeit with a more modest and variable advantage for inflation.
Recent research using more current data has challenged the Romers' findings about the Fed's informational advantage. Lukas Hoesch, Barbara Rossi and Tatevik Sekhposyan show that when accounting for changes over time, evidence of a strong Fed information advantage has weakened in recent years. Consistent with this view, Chad Fulton and Kirsten Hubrich document substantial regime-dependent instability in inflation forecasting accuracy.
Taken together, this literature prompts a simple question: In the prepandemic, low-inflation era, do Federal Reserve staff forecasts still outperform professional forecasts in a meaningful way—or has the Fed advantage narrowed, and along which dimensions does it persist, if at all?
What we compare and why
We compare four-quarter forecasts of headline CPI inflation from two sources. The first is Federal Reserve Board staff projections gathered in what is called the Tealbook (called the Greenbook before 2010). The second consists of consensus forecasts from Blue Chip Economic Indicators, which aggregate professional forecasters’ views. Headline CPI is not the only relevant inflation measure, but it is central for household decisions and offers long, consistent historical coverage across both sources—essential for meaningful forecast comparisons.
Forecasts are aligned by release month, matching each Tealbook vintage with the Blue Chip survey from the same month. This approach is conservative for judging staff performance, as Blue Chip surveys are often released a few days earlier in the month, potentially giving the Tealbook a slight real-time informational advantage. Our sample uses the longest span available from publicly released Tealbook vintages (Chart 2).
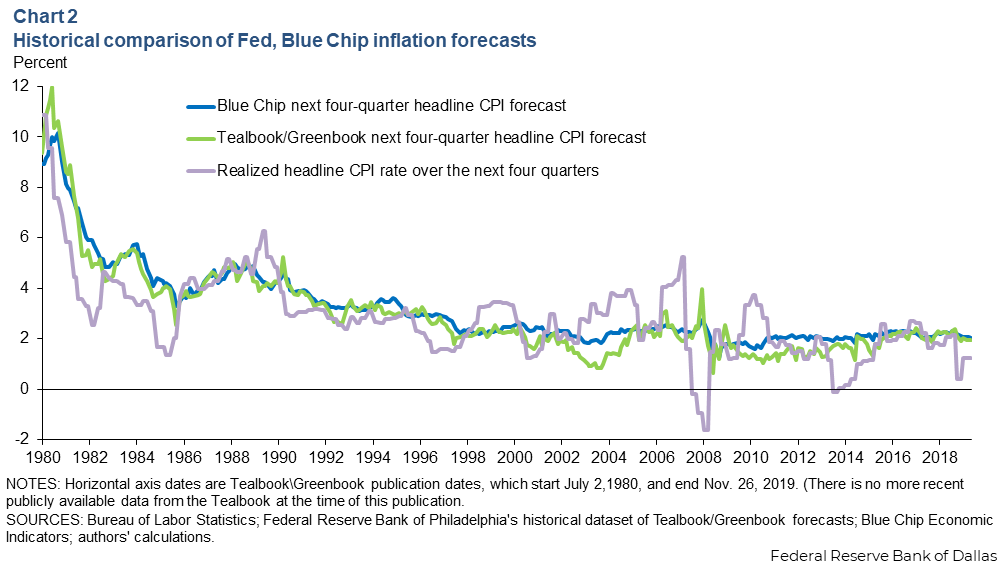
Two features stand out. First, staff forecasts often move more sharply than the Blue Chip consensus. While Blue Chip forecasts evolve more smoothly and remain closely tied to recent inflation outcomes, staff forecasts appear less inertial and more judgment-driven, showing a greater willingness to break from recent experience at key episodes.
Second, such departures are not necessarily more accurate. The early-2000s deflation scare illustrates this point. Staff forecasts in some vintages diverged noticeably from private forecasts, yet the staff’s projections did not pan out relative to subsequent outcomes. The broader lesson is that forecasts that appear bold can still be wrong, while steadier forecasts can embed valuable information. These observations underscore the need to evaluate performance systematically rather than episode by episode.
To evaluate forecasting performance, we compare forecast errors—defined as realized inflation minus the forecast—focusing separately on average accuracy, tail risks and how performance evolves.
Average accuracy indicates near parity
Table 1 reports a summary measure of how large forecast mistakes tend to be on average. With forecast errors defined as realized minus forecasted inflation, positive errors correspond to inflation overshooting forecasts (underprediction) and negative errors correspond to inflation undershooting forecasts (overprediction).
| Forecast error = realized inflation - forecast (best value in bold) | |||
| Fed Tealbook | Blue Chip | Average forecast | |
| Mean squared forecast error | 1.63 | 1.58 | 1.54 |
| NOTE: Sample consists of 318 of the Fed's Tealbook/Greenbook releases from July 1980 to December 2019. The comparison covers the forecast of the next four-quarter inflation rate. SOURCES: Bureau of Labor Statistics; Federal Reserve Bank of Philadelphia's historical dataset of Tealbook/Greenbook forecasts; Blue Chip Economic Indicators; authors' calculations. |
|||
In the prepandemic sample, Tealbook forecasts have a mean squared forecast error of 1.63, compared with 1.58 for Blue Chip—only about 3 percent worse. A simple average of the two performs slightly better than either one alone, with a mean squared error of 1.54.
The key takeaway is not that either group forecasts poorly, but that staff forecasts on average don’t dominate professional forecasts during the prepandemic period.
Tail risks reveal different strengths
Table 2 shows that average accuracy can mask important asymmetries. When inflation turns out much higher than forecasted, Blue Chip errors are smaller, indicating fewer severe underpredictions. When inflation undershoots forecasts, staff forecasts perform somewhat better at certain percentiles.
| Forecast error = realized inflation - forecast (best values in bold) | |||
| (Negative values: Inflation undershoots forecasts) | |||
| Fed Tealbook | Blue Chip | Average forecast | |
| 5th percentile | -2.63 | -2.61 | -2.51 |
| 10th percentile | -1.84 | -2.04 | -1.93 |
| (Positive values: Inflation overshoots forecasts) | |||
| Fed Tealbook | Blue Chip | Average forecast | |
| 90th percentile | 1.61 | 1.20 | 1.32 |
| 95th percentile | 2.17 | 1.60 | 1.87 |
| NOTES: Sample consists of 318 of the Fed's Tealbook/Greenbook releases from July 1980 to December 2019. The comparison covers the forecast of the next four-quarter inflation rate. SOURCES: Bureau of Labor Statistics; Federal Reserve Bank of Philadelphia's historical dataset of Tealbook/Greenbook forecasts; Blue Chip Economic Indicators; authors' calculations. |
|||
Forecast rankings therefore depend on which risks matter most. Professional forecasts appear better at limiting large inflation overshoots—and that is before the pandemic—while staff forecasts show relative strength in parts of the downside tail of inflation misses.
Forecast error size prompts ranking shifts
Chart 3 shows rolling-window mean squared forecast errors using successive Tealbook vintages, computed over the most recent 100 releases in each window. Earlier in the sample, staff forecasts perform better, consistent with the traditional Fed advantage narrative. From the early-2000s deflation scare onward, Blue Chip forecasts generally exhibit persistently lower mean squared forecast errors.
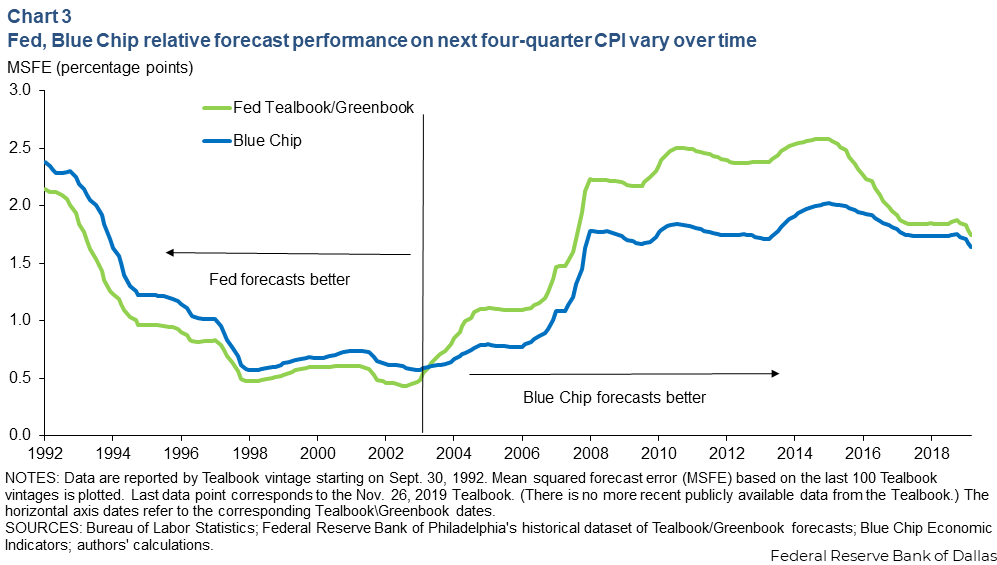
This time variation reinforces another important takeaway: Any informational advantage should not be taken for granted. Changes in inflation regimes, in the information available and in how that information is processed, can alter relative forecast performance over time.
Moreover, the period from the mid-1990s to the 2008 Global Financial Crisis was a period of unusually small forecast errors, while errors have grown larger since—returning to levels last seen in the early 1990s—underscoring that sustained improvements in forecasting accuracy cannot be assumed either.
What the Tealbook and Blue Chip can—and cannot—tell us
Taken together, the results point to a balanced interpretation. First, in the prepandemic era of largely-anchored inflation expectations, staff forecasts are not clearly superior on average. Second, forecasting performance is multidimensional, with meaningful differences in the tails of the forecast-error distribution. Third, relative accuracy changes over time, making static claims about the Fed information channel potentially misleading.
Limits, learning and forecast combination
The postpandemic inflation surge underscored a basic constraint of forecasting: Some shocks are inherently difficult to anticipate.
The prepandemic evidence highlights two further lessons. First, forecasting performance is not a fixed institutional attribute. Relative accuracy evolves with inflation regimes, communication practices and information processing. Our results suggest that any information advantage of the Federal Reserve Tealbook forecasts had weakened before the pandemic.
Second, forecast combination offers a practical risk-management tool. A simple average of Tealbook and Blue Chip forecasts outperforms either source alone, on average, reflecting gains from diversification across imperfect signals. While the gains are modest and uneven across the tails, forecast combination provides a simple yet useful way to improve forecast reliability.
The broader implication is constructive. Forecasting may appear more accurate in calm periods, but that appearance can be misleading. The focus should be on understanding where forecasts add information, and how to adapt as conditions change, for instance, by monitoring tail risks and combining insights across sources.
About the authors

Alexander Chudik is an assistant vice president in the Research Department at the Federal Reserve Bank of Dallas.

Enrique Martínez García is an assistant vice president in the Research Department and co-director of the Global Institute at the Federal Reserve Bank of Dallas.