Skewness warrants caution as Trimmed Mean PCE inflation eases
A widely used method of assessing the medium-term underlying trend of inflation is to omit categories of price changes reflected in headline inflation that are volatile and unlikely to persist.
One of the most common measures excludes food and energy prices, and is often called “core” inflation. Another is Trimmed Mean PCE inflation, which excludes price changes above and below certain percentile thresholds.
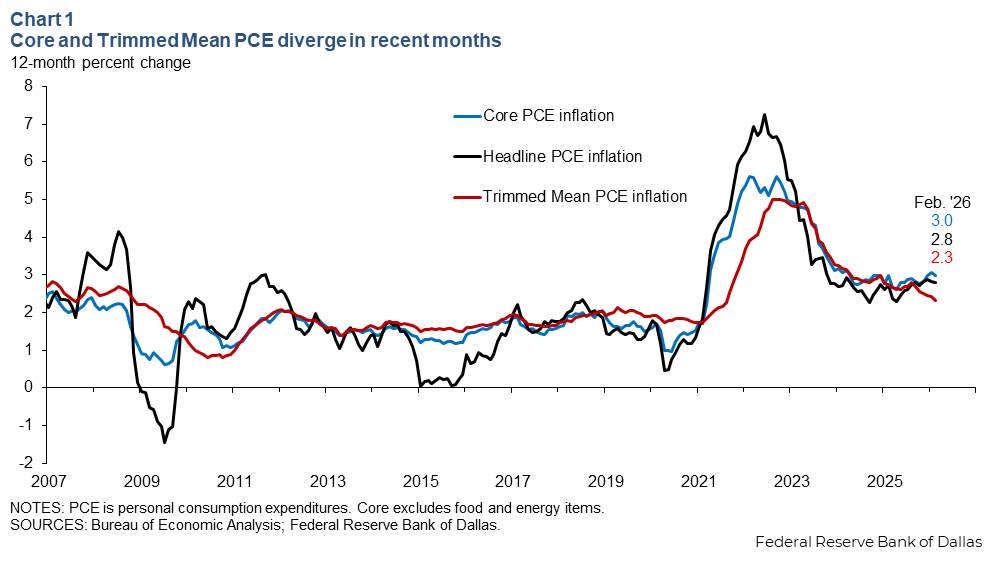
The 12-month rates of core personal consumption expenditures (PCE) inflation and Trimmed Mean PCE inflation moved within a close range of each other from 2023 through September 2025 (Chart 1). But after that, the two measures diverged. Core PCE increased to 3.0 percent through February, while Trimmed Mean PCE declined to 2.3 percent.
The seemingly divergent moves prompt the question: Has the underlying trend of inflation continued to slow in recent months, or have inflationary pressures strengthened?
Trimmed Mean PCE inflation has many advantages over core PCE, including a tighter relationship with labor market slack as well as smaller subsequent revisions. The most important feature of a measure of an underlying trend of inflation occurs after it and headline inflation deviate. On average, headline inflation should converge toward the measure of trend rather than toward something else.
Headline inflation typically converges towards trimmed mean
Chart 2 shows the results of an exercise to test whether headline PCE inflation is more likely to converge toward core or trimmed mean. Regressions are estimated to predict the change in 12-month headline PCE inflation over horizons of one to 24 months, with a separate regression for each horizon. The predictors in the regression include the deviation of core PCE inflation from headline, the deviation of Trimmed Mean PCE inflation from headline, and lags of the changes of all three inflation measures.
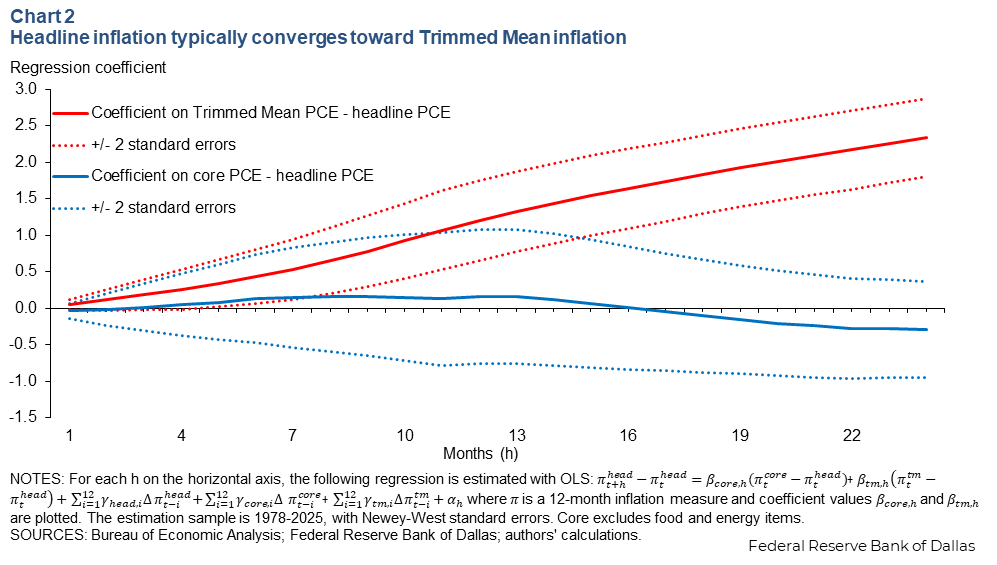
The chart shows the coefficients on the gap between core and headline and the gap between trimmed mean and headline over the various horizons. A coefficient that is close to one implies that when a gap opens up between headline inflation and the measure of trend, headline inflation generally converges to that measure of trend over that horizon. A coefficient of zero, or not statistically different from zero, implies the measure of trend provides little predictive power beyond the other information included in the regression.
The coefficient on the trimmed mean gap steadily increases with the horizon and is near one after 12 months. The coefficient on the gap with core is near zero and statistically insignificant across horizons. This is consistent with the conclusion from other studies that trimmed mean is typically a more reliable indicator of where headline inflation is headed than core.
Skewness changes can distort trimmed mean signal
The tails of the distribution in Trimmed Mean PCE are not trimmed symmetrically. Percent price changes across 177 PCE categories are sorted each month, changes below the 24th percentile and above the 69th percentile are dropped. The weighted average of the remaining categories is the trimmed mean. These thresholds were selected so that the trimmed mean best matched three different measures of the medium-term trend of headline inflation from 1977–2009.
The thresholds were allowed to be asymmetric to address an important feature of the price-change distributions: They are, on average, “negatively skewed” during 1977–2009. This means that for a typical month, the average of, say, the bottom 10 percent of price changes is much further below the median of the distribution than the average of the top 10 percent is above the median.
Trimming symmetrically—for example dropping the top and bottom 10 percent—would put the average of the remaining 80 percent somewhere above the mean of the entire distribution of price changes. Doing this month after month would produce a trimmed mean inflation rate that, on average, exceeded the all-items headline inflation rate. Trimming more from the top than from the bottom corrects this potential upward bias.
However, research has shown that when the skewness of the price change distribution shifts from the usual negative to positive, the signal from the trimmed mean can be misleading. The trimmed mean continues to drop more from the top of the distribution than from the bottom. But if the distribution is not negatively skewed, this gives a downwardly biased measure of underlying trend. This likely contributed to the delayed rise of the trimmed mean during the inflation spike of 2021.
Chart 3 plots a measure of skewness in the one-month price change distribution. Over the past several months, the skewness has increased, with the 12-month average of monthly skewness readings roughly zero through February 2026.
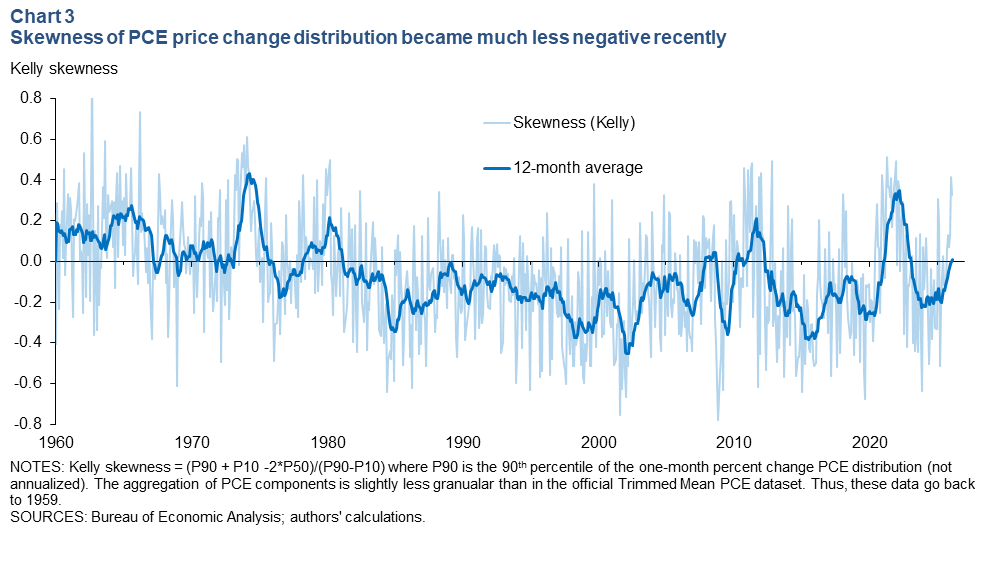
Some other periods of sharp increase in skewness preceded or coincided with inflation surges, where the trimmed mean lagged behind core and headline PCE inflation (1974 and 2021). However, this is not universally the case. One of the sharpest increases in skewness occurred in 2012, after which inflation remained largely subdued and near 2 percent.
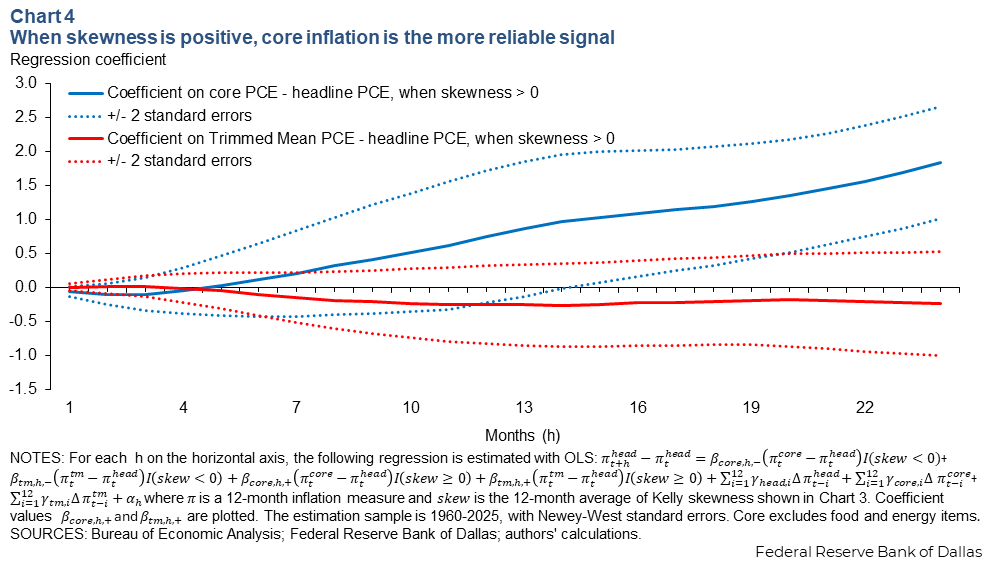
Chart 4 reruns the analysis from Chart 2, but differs in that it only considers periods where skewness is positive. The sample is expanded to start in 1960 using a slightly less granular level of aggregation than what the official trimmed mean uses. This allows more periods with positive skewness. In these periods, headline inflation more reliably converges toward core PCE, while the coefficients on trimmed mean are close to zero.
This analysis suggests that the currently lower Trimmed Mean PCE inflation rate relative to the core PCE inflation rate may not be strong evidence of disinflation ahead if price changes continue to exhibit a positive skew and the trimmed mean PCE cuts too many of these changes. This raises the question of what’s caused the recent gap between headline inflation and Trimmed Mean PCE inflation—and indirectly driving the more positive skew—as well as whether to expect this gap to persist.
Core goods help drive widening gap between headline, trimmed mean
The gap between headline and Trimmed Mean PCE inflation can be decomposed into contributions from the lower tail and upper tail, and then further disaggregated by category (Chart 5).
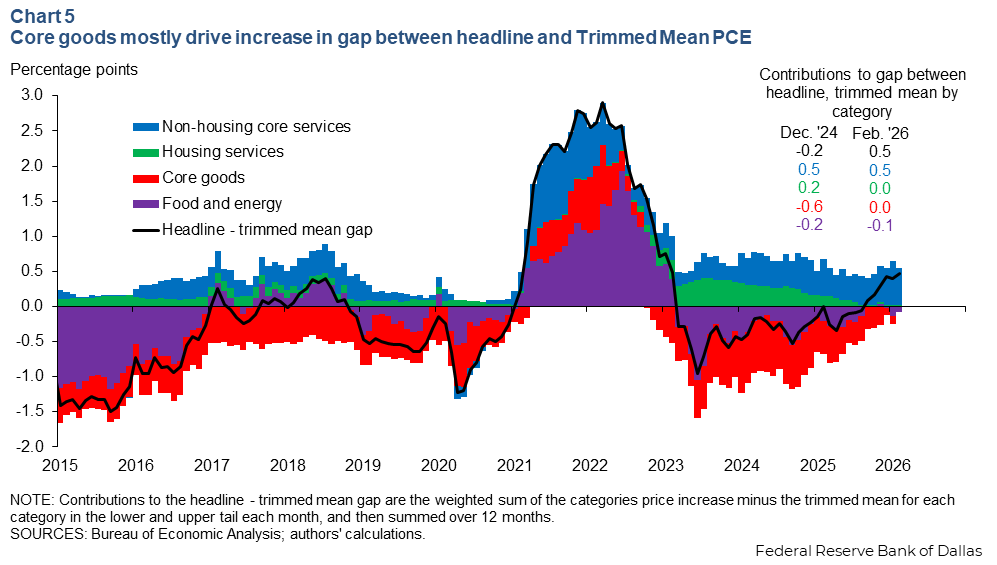
As of December 2024, core goods contributed -0.6 percentage points to the gap, a typical contribution over the prepandemic period. Over the 12-month period ended in February 2026, there were fewer core goods price declines and more large price increases, accounting for 0.6 percentage points of the 0.7 percentage-point increase in the headline-trimmed mean gap. In contrast, the contribution to the increase in the gap from non-housing core services was minimal.
This is consistent with tariffs driving skewness higher. A more direct approach to assessing the change in skewness, a Shapley decomposition, also shows core goods as a main driver, although also with an important role from housing, and little impact from other services, and food and energy.
If tariffs represent a one-time increase in the price level, without a persistent effect on inflation, the increased skewness should be transitory, restoring the reliability of Trimmed Mean PCE as a measure of trend after tariff impacts on inflation fade. However, the upside contributions from non-housing services have increased somewhat since September. If this trend in positive price changes continues, it could be the beginning of broadening inflationary pressures.
Is composition of excess core inflation still consistent with disinflation?
If skewness is weakening the signal from trimmed mean, does that indicate inflation is stuck near 3 percent? Not necessarily. Heading into this episode of higher tariffs, the trimmed mean wasn’t expected to provide a measure of the underlying trend excluding the effects of tariffs. The trimmed mean filters outliers, and gradual increases in goods prices from tariffs may not be outliers.
Chart 6 updates the calculation of excess core inflation from Atkinson and Dolmas (“What is keeping core inflation above 2 percent,” 2025), but further splits out non-housing core services into market-based categories, portfolio management fees and other non-market core services.
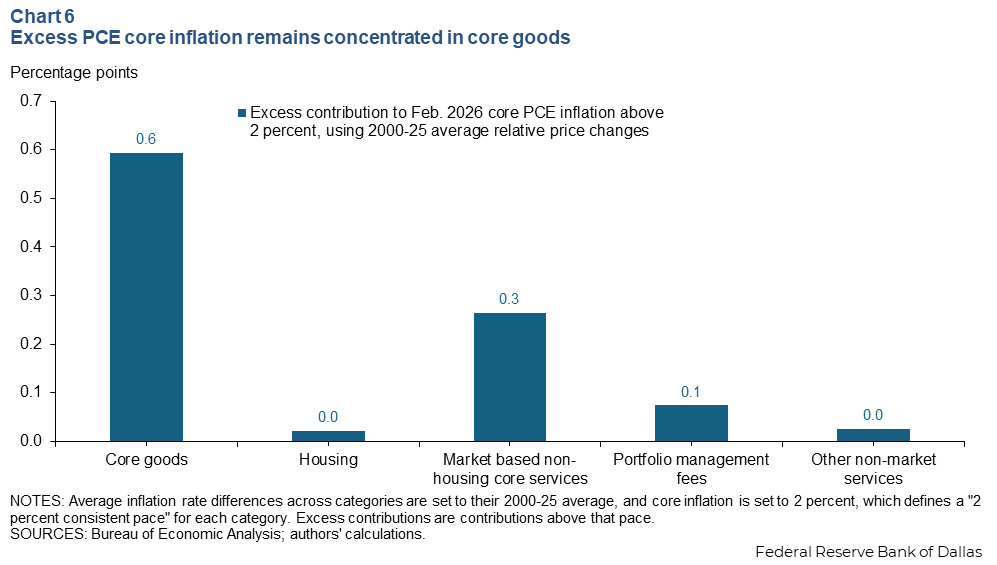
The composition of core inflation is still supportive of disinflation, because core goods accounted for more than half of the overshoot through February 2026. If this is primarily tariff-driven and a one-off price level change, that excess contribution should fade over the coming year.
Similarly, housing services inflation can be expected to continue to slow toward market-rent measures and subtract a couple of tenths of a percentage point from core inflation by 2027. If equity price growth slows to a more historically normal pace ahead, a similar amount of disinflation from portfolio management fees can be expected.
Together, the expected slowing from those categories would be enough to return core inflation to near 2 percent by 2027, even without much slowing from market-based non-housing core services. However, each of these sources of expected disinflation is subject to considerable uncertainty, particularly at a horizon of several years. Additionally, the non-housing core services group has shown some acceleration in early 2026 and is an increasing source of upside outliers. Further acceleration would likely be inconsistent with inflation returning to target.
Moreover, if persistent, disruption of oil supplies and related products in the Middle East could add upward pressure on goods and services that use these products as inputs, in addition to raising headline inflation from rising energy prices. In such a case, we could continue to see the skew of price changes remain positive.
About the authors

Tyler Atkinson is a senior business economist in the Research Department of the Federal Reserve Bank of Dallas.

Jim Dolmas is an assistant vice president in the Research Department of the Federal Reserve Bank of Dallas.

Rebecca Zarutskie is senior vice president and senior research advisor at the Federal Reserve Bank of Dallas