
Alternative Trimmed Mean PCE inflation measure better tracked price surge
To gauge the medium-term trend in underlying inflation, the Dallas Fed’s Trimmed Mean personal consumption expenditures (PCE) inflation rate drops price changes in the tails of the monthly distribution of PCE components, minimizing the impact of outliers.
The amount trimmed from each tail of the distribution is set to best match the trend of inflation over a specific period. We find that the performance of the trimmed mean is sensitive to the period used for setting the trim points. For some evaluation metrics, a version of the trimmed mean calibrated with a larger sample than the original trimmed mean outperforms the original. This alternative version currently yields a more elevated inflation reading.
The original trimming points were calibrated to track the trend in all-items, or headline, PCE inflation covering 1977–2009, a period when the downside outliers were generally more extreme than the upside outliers. The best choice of trimming proportions for that environment calls for removing more price changes from the upper tail of the price change distribution than from the lower tail each month.
As we noted in a recent article, these asymmetric trims may cause the trimmed mean to be slower to pick up inflation surges relative to inflation excluding food and energy—or core inflation—when the distribution of price changes skews positive, as it did in 2021. Calibrating the trimming proportions over a longer period that includes the inflation surges of the 1970s leads to lighter, more symmetric trims of the monthly price change distributions.
The trimmed mean PCE inflation rate calibrated over this longer sample does not clearly outperform the original trimmed mean (which removed more upper tail price changes) in predicting inflation at all points. However, it was more accurate during the 2021 inflation surge when positively skewed price changes presaged a rise in headline inflation.
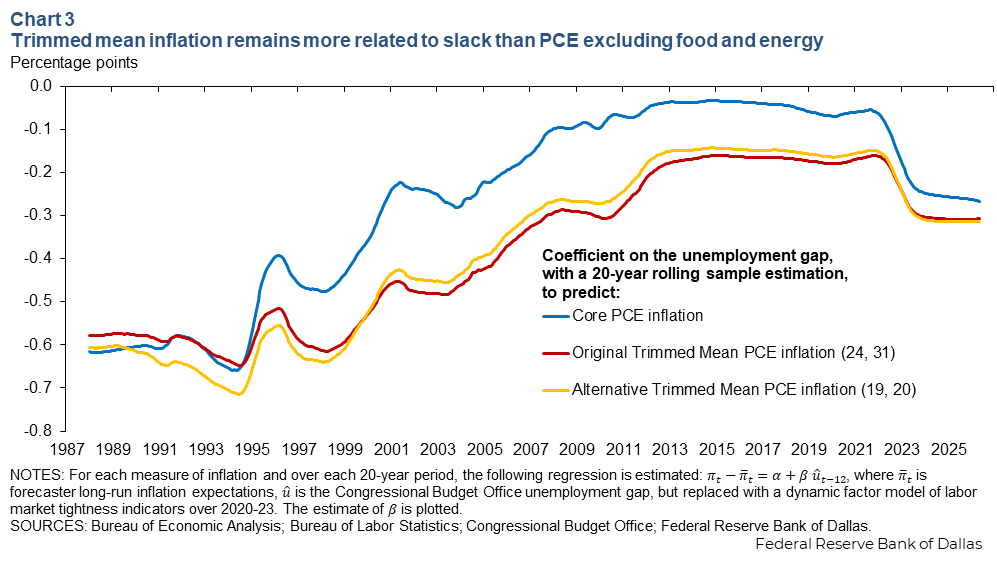
Both trimmed means have had a tighter relationship with economic slack, or the underutilization of economic resources, since the mid-1990s than has core PCE inflation, with the original trimmed mean doing a bit better on this dimension than the alternative over most of that period.
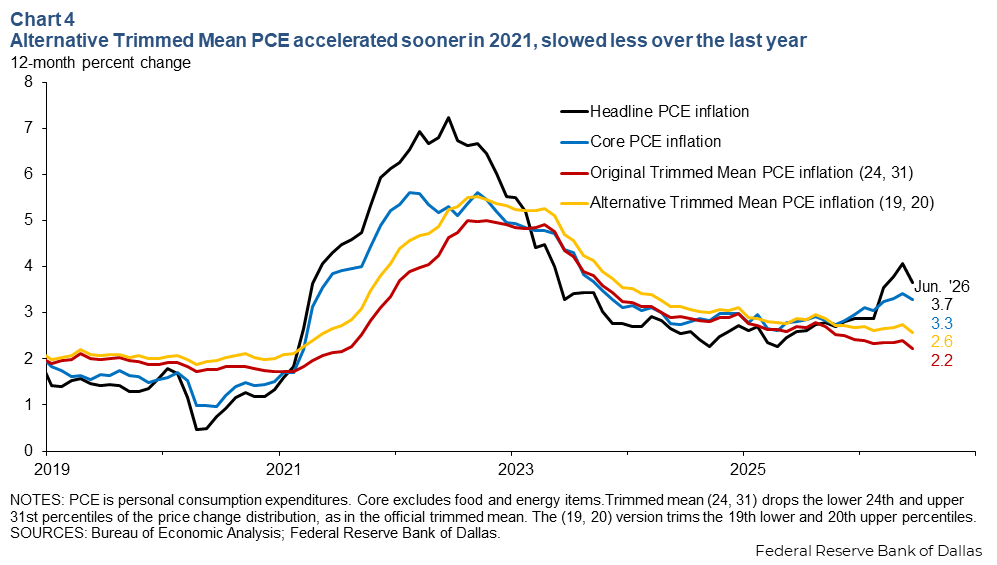
The recalibrated alternative trimmed mean currently stands at 2.6 percent for the 12 months ended in June, compared with 2.2 percent for the original trimmed mean.
Recalibration leads to more symmetric trim points
To calibrate the trimming points, we use a sample from January 1967 to June 2009— starting 10 years earlier than the calibration sample for the original trimmed mean but ending at the same point in 2009.
The original trimmed mean’s 1977 start date was chosen to strike a balance between sample length and the degree of disaggregation in the underlying components—going further back in time means accepting a coarser set of components. Stretching the dataset back to include all of the 1970s required aggregating several components, reducing the total from the current version’s 177 to 172. We maintained the end of the calibration sample to be in 2009, so we could use the post-2009 data as a validation sample, which helps guard against overfitting.
We choose the trim proportions to minimize the distance between the resulting one-month trimmed mean inflation rates and a centered 36-month moving average of headline inflation. This is similar to, though a bit simpler than, the calibration strategy behind the original trimmed mean. The resulting trims are at the 19th lower percentile (the left tail) and at 20th upper percentile (the right tail), roughly symmetric and lighter than the 24/31 trims used in the original trimmed mean (Chart 1). This likely reflects the longer calibration period’s inclusion of more periods of positively skewed price changes and extreme price movements that were indicative of shifting trends, rather than just noise.
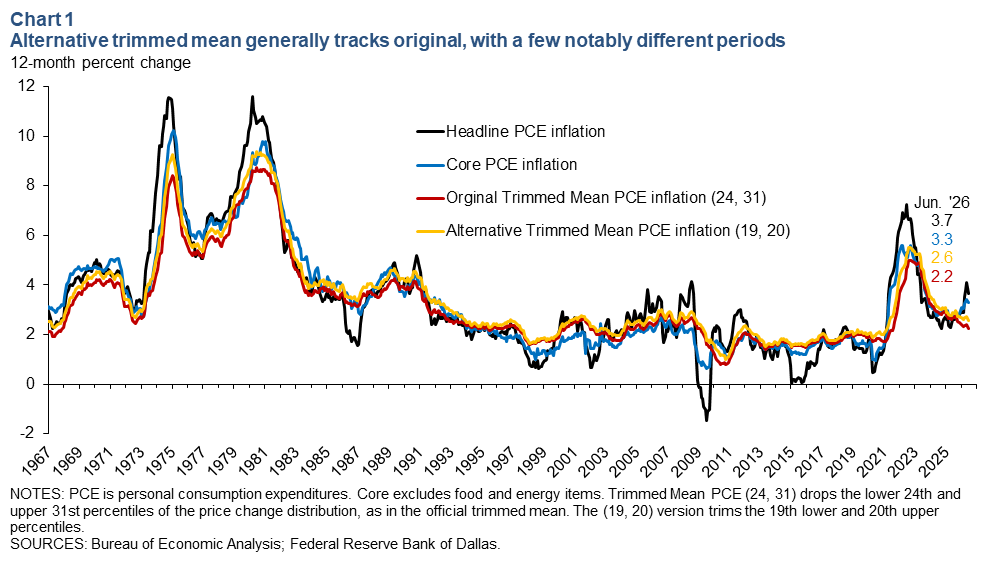
The 19/20 trimmed mean tracks the original trimmed mean during most periods. Other research has shown that a wide range of trim points often give similar results, although they differ during a few key periods.
In the 1967–80 period, the 19/20 trimmed mean ran above the original by about 0.4 percentage points and closer to the trend in headline inflation, reflecting that price-change distributions over this period were positively skewed; the original trim points underestimate the trend.
From the mid-1980s to mid-1990s, the 19/20 trimmed mean generally ran above the original calibration, but it is less clear this is an improvement. Headline inflation drifted lower, a change the original trimmed mean better signaled than either the alternative calibration or core inflation.
The root-mean squared error relative to the 36-month moving average of inflation is lower for the 19/20 trimmed mean than the original during the calibration period (which is by construction) but also in the validation period, implying robustness to the approach (Table 1). However, the differences are quite small. Both versions of the trimmed mean have a better fit to trend than core inflation, reflecting reduced monthly noise.
Table 1. Root mean squared error from trend is best for alternative (19,20) calibration
| Calibration | Validation | |
Original trimmed mean (24,31) | 0.090 | 0.070 |
| Alternative trimmed mean (19,20) | 0.086 | 0.068 |
| Core PCE inflation | 0.120 | 0.097 |
| NOTES: Table reports root mean squared deviation of the monthly, not annualized, inflation rate from the 36-month centered moving average of headline inflation. Calibration period is 1967–June 2009. The validation period is July 2009–November 2025. SOURCE: Authors’ calculations. | ||
Inflation measures’ accuracy depends on time period
The trimmed mean was designed and calibrated to track the trend in headline inflation, but the accuracy as a predictor of future inflation is also of interest. Chart 2 plots the accuracy of three different inflation measures as simple predictions of headline inflation over the following 12 months, with five-year rolling window samples. Lower values indicate more accurate predictions.
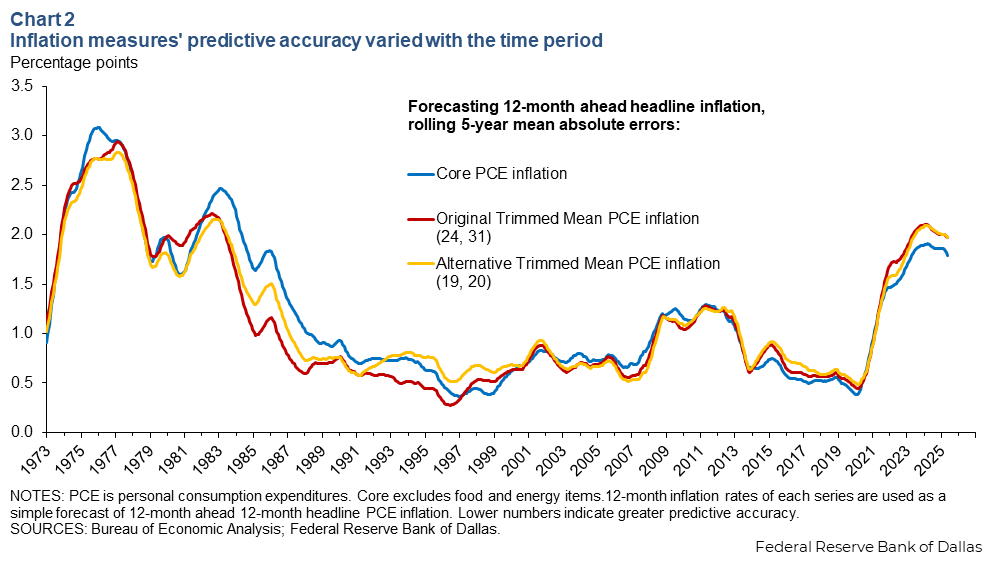
The results are mixed across time. Through the mid-1980s, the 19/20 trimmed mean generally performed the best. Over the mid-1980s to mid-1990s, the original trimmed mean was most accurate, best capturing the gradual disinflation over that period. Since 2000, all three measures have performed roughly the same, although in recent years core PCE inflation has been the most accurate predictor.
Both trimmed means more closely tied to economic slack than core PCE
In addition to predicting future inflation, a benefit of the trimmed mean is a stronger relationship with economic slack—as measured by the unemployment gap (the difference between the unemployment rate and the “natural” rate)—than headline or core inflation. Put differently, the trimmed mean better reflects the component of inflation related to demand that monetary policy can control.
Chart 3 updates regressions estimated by Jim Dolmas and Evan Koenig (“Room to grow? Inflation and labor market slack,” 2019). It uses 20-year rolling regression windows. Before the pandemic, the relationship between slack, as measured by the unemployment gap, and core inflation was near zero, while more negative with both versions of the trimmed mean. This negative correlation means that when the unemployment rate rises, trimmed mean inflation falls.
In 2021, the labor market became extremely tight and inflation surged, driving all three inflation measures to be more negatively correlated with slack. The original trimmed mean generally has a more negative and more stable relationship with slack over the periods considered.
Alternative trimmed mean picked up inflation surge earlier
The inflation surge of 2021 is a period of particular interest that drove this line of inquiry. The original trimmed mean was much slower to accelerate than core or headline. While headline and core exceeded 3 percent in April, trimmed mean did not until November (Chart 4). The alternative trimmed mean accelerated somewhat earlier than headline and core, slightly exceeding 2 percent in January and February. The acceleration over the rest of 2021 was less pronounced than headline but was much timelier than the original trimmed mean.
Alternative trimmed mean signals somewhat higher inflation
As inflation declined and stabilized from 2023 to mid-2025, the versions of trimmed mean and core inflation moved closely together. Since then, core has accelerated to mid-3 percent, while the original trimmed mean continued to slow roughly a percentage point lower. Earlier this year, we cautioned that the original trimmed mean may be less reliable and slow to signal broadening and accelerating inflation in an environment of elevated skewness.
This evidence doesn’t offer a clear-cut conclusion on whether the original trimmed mean is a better measure than the alternate version, just as empirical evidence comparing core and trimmed mean inflation is typically inconclusive.
However, while skewness remains elevated, as it has through June, our analysis suggests that greater weight should be placed on the alternative trimmed mean as a measure of the medium-term trend in inflation (Chart 5).
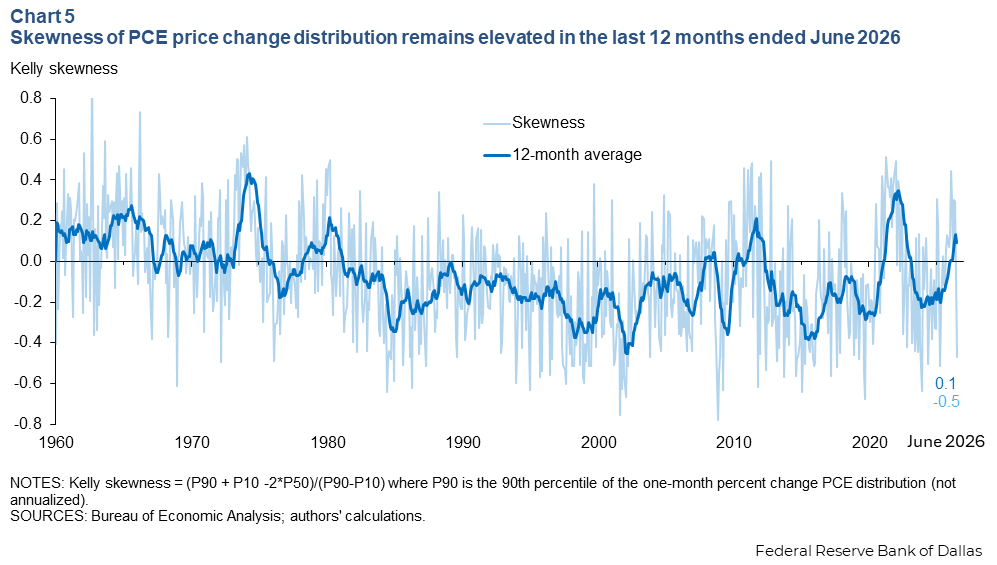
The alternative trimmed mean currently lies between the original trimmed mean and core inflation, at 2.6 percent. This signals some of the strength in core inflation is likely noise or one-off disturbances unlikely to be repeated, but the medium trend is likely still more elevated than currently suggested by the original trimmed mean at 2.2 percent.
About the authors

Tyler Atkinson is a senior business economist in the Research Department of the Federal Reserve Bank of Dallas.

Jim Dolmas is an assistant vice president in the Research Department of the Federal Reserve Bank of Dallas.

Rebecca Zarutskie is senior vice president and senior research advisor at the Federal Reserve Bank of Dallas
