
Mitigating tariffs via USMCA may have limited 2025 price increases
Higher tariffs do not automatically show up one-for-one in consumer prices. Price effects depend on how firms respond. Foreign exporters may cut pre-tariff prices to preserve access to the U.S. market, while domestic importers or retailers may absorb part of the increase with lower margins.
Firms can also reduce the duties they pay by changing how goods enter the country. An important adjustment margin in 2025 was a sharp increase in imports from Mexico and Canada entering the U.S. under United States–Mexico–Canada Agreement (USMCA) preferences.
By shifting more trade into lower-tariff or duty-free channels, firms reduced the effective tariff burden at the border. Relative to a counterfactual in which USMCA compliance remained at 2024 levels, this shift reduced the realized tariff burden by about 1 percentage point in the fourth quarter of 2025, lowering the PCE price impact by roughly 9 basis points (0.09 percentage points) overall. The reduction is more substantial for goods, especially durables (typically, items that can be stored and have an average useful life of three or more years).
Tariff mitigation changes the inflation arithmetic
The tariff actually paid, not the statutory rate, is what really matters to firms and consumers. Evidence from 2025 indicates that exporters in Mexico and Canada sharply increased USMCA compliance, with roughly 80 percent of imports from both partner countries entering duty-free under preferential treatment rather than incurring the now higher fallback tariff rate.
To quantify the effect, we compare observed tariff rates after the 2025 increase in USMCA use with a counterfactual in which the share of imports entering under the trade agreement remained at 2024 levels (Chart 1). In that counterfactual, a larger share of trade would have entered outside the agreement and faced higher duties.
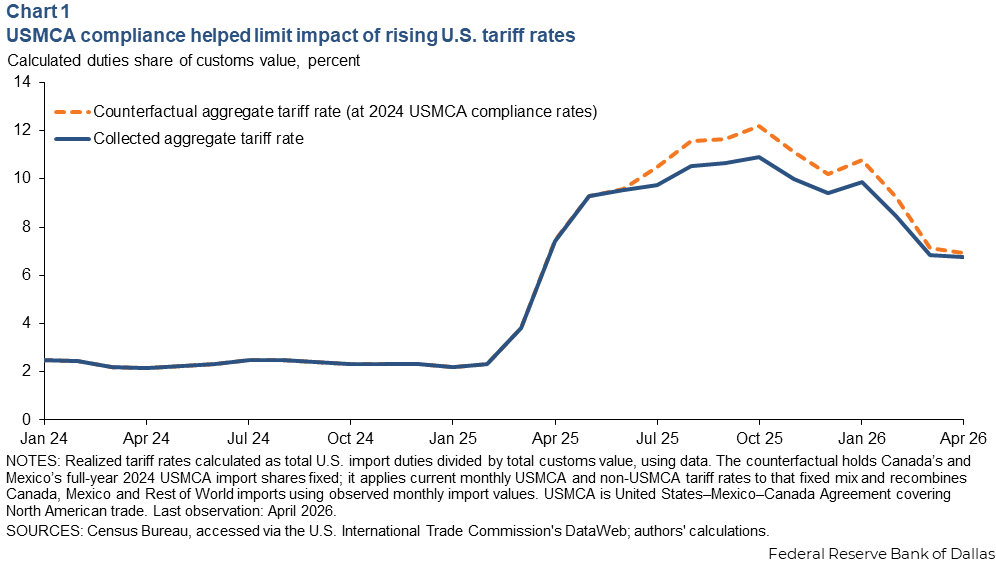
Our estimates indicate that increased compliance reduced the overall realized average tariff rate by about 1 percentage point relative to that counterfactual in the fourth quarter of 2025. Put differently, the compliance response muted the effective tariff shock U.S. importers faced.
Sectoral differences in tariff mitigation
Tariff mitigation varied substantially across industries because of firms’ differing abilities to meet rules-of-origin requirements, reorganize sourcing and document eligibility (Chart 2).
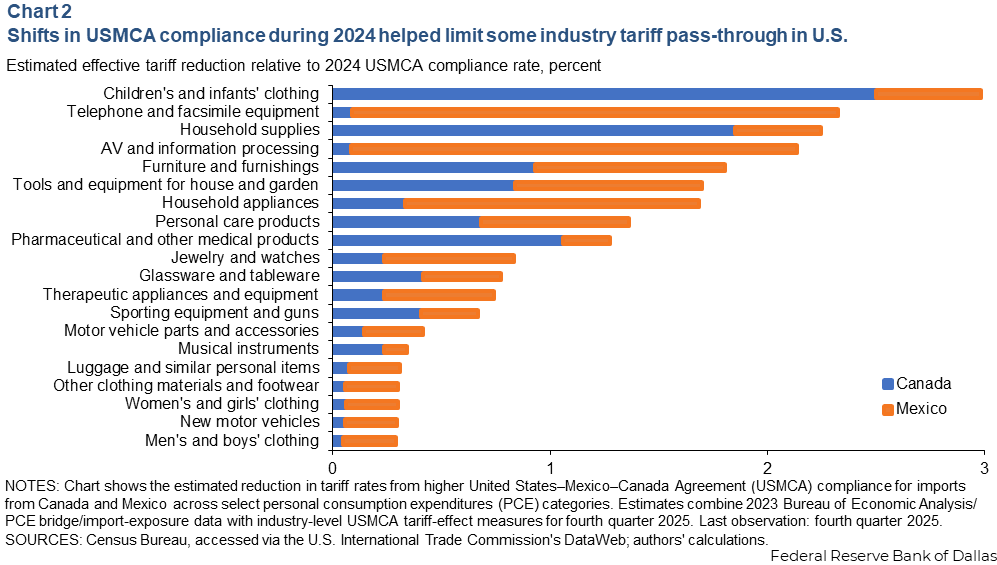
The largest tariff reductions appear in children’s and infants’ clothing, telephone and facsimile equipment, household supplies, audio-visual (AV) and information-processing equipment, furniture and furnishings, tools and equipment for house and garden, household appliances, personal care products and pharmaceutical and other medical products.
Mitigation effects were smaller in lesser categories, such as luggage and personal accessories or musical instruments, among others. Some industries already had high USMCA compliance; others rely more heavily on non-North American inputs or face USMCA rules-of-origin requirements that are too costly to satisfy. This heterogeneity matters most for where price relief shows up, rather than just for the aggregate inflation effect.
From tariffs to consumer prices
Consumer-price effects cannot be assessed from import prices and their direct weight in household consumption alone. Many U.S.-consumed goods are produced domestically but with imported inputs, so tariff changes also move through supply chains into final prices.
To quantify this transmission, we follow the approach of Boston Fed economists Omar Barbiero and Hillary Stein, which uses Bureau of Economic Analysis (BEA) data to trace imported goods and imported inputs through U.S. production and into PCE consumer-price categories. The framework captures direct exposure through imported final goods purchased by households and indirect exposure through imported inputs embedded in goods and services produced domestically. Using the combination of direct and indirect exposure, we map tariff-induced import price changes onto consumer prices.
Imports account for roughly 10 percent of household consumption once direct and indirect channels are combined, but exposure varies sharply across categories (Chart 3). Goods contain far more imported content than services, especially durable goods such as electronics, appliances and household equipment. Durable goods embody import exposure of about 30 percent once imported inputs are included, compared with about 5 percent for services.
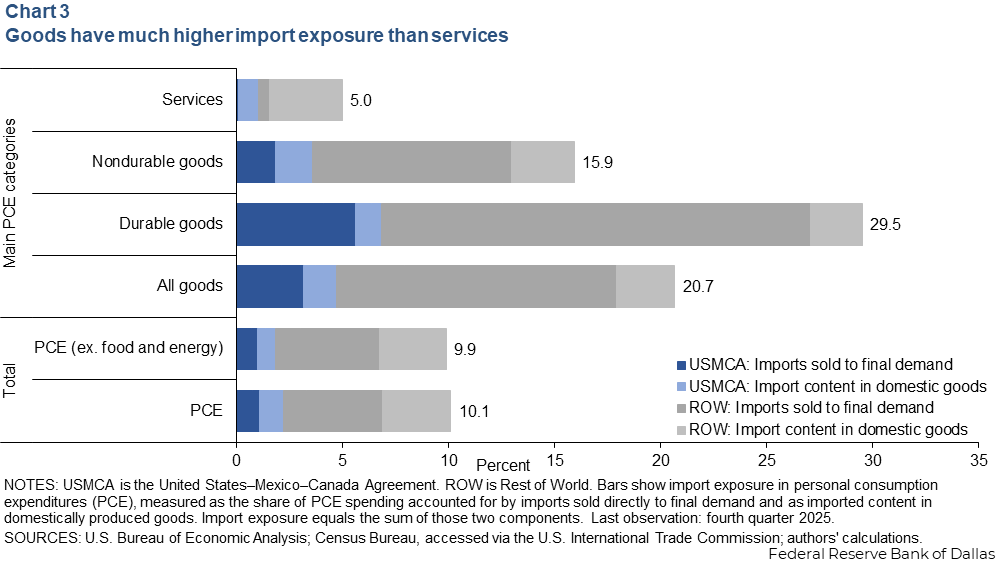
USMCA partners account for about 2.2 percentage points of total PCE import exposure of 10.1 percent. Mexico contributes 1.2 percentage points, split between 0.7 from final-demand imports and 0.4 from imported content in domestic goods, while Canada contributes 1.0 percentage point, with 0.4 from final-demand imports and 0.7 from embedded import content. By comparison, China accounts for 1.4 percentage points, and the rest of the world accounts for 6.5 percentage points.
Estimated inflation effects
We can combine the import-exposure weights in Chart 3 with the estimated tariff mitigation from higher USMCA compliance. At the headline level, the simple aggregate arithmetic—about 1 percentage point of avoided tariff burden multiplied by roughly 10 percent import exposure—implies an effect near 10 basis points (0.10 percentage points). The bottom-up mapping across industries and PCE categories gives 9 basis points, a very similar result (Chart 4).
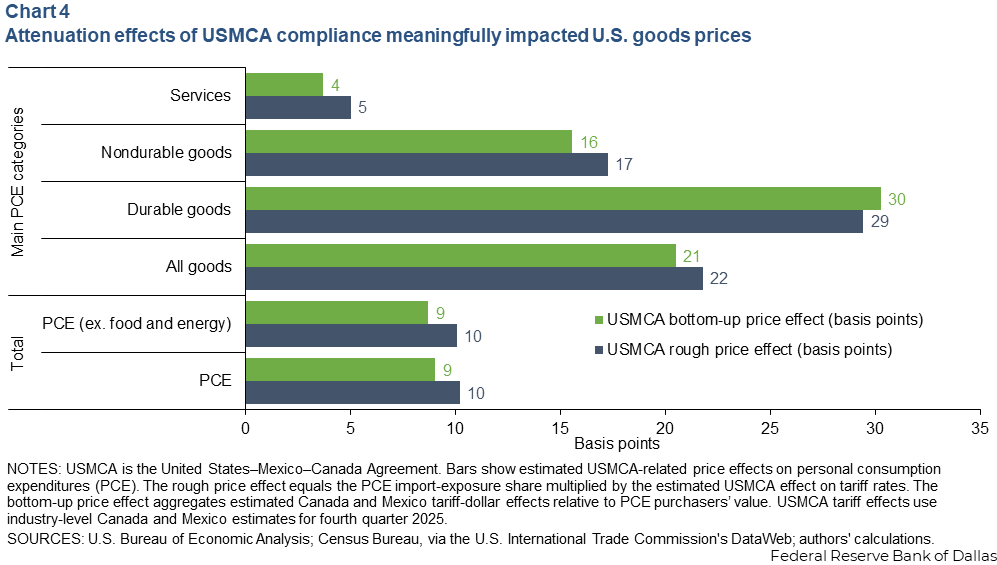
Using observed increases in USMCA compliance between 2024 and fourth quarter 2025, we estimate the bottom-up price impact of tariff mitigation under a benchmark in which import prices rise by the full tariff. In practice, pass-through may be smaller if exporters absorb part of the tariff through the terms-of-trade channel, or if domestic importers and retailers absorb part of it through lower margins.
Our preferred bottom-up estimates in Chart 4 suggest that higher USMCA compliance lowered the U.S. price level by approximately:
- 9 basis points for headline PCE and core PCE (excluding food and energy)
- 21 basis points for all goods PCE
- 30 basis points for durable goods prices
- 16 basis points for nondurable goods prices
- 4 basis points for services prices
The aggregate effect is modest because services dominate household spending and have limited import exposure. However, the goods effect is materially larger because these sectors rely more heavily on imported final goods and foreign intermediate inputs.
Why the effect matters
These estimates isolate one adjustment channel: increased use of preferential access under USMCA. They exclude other firm responses that may also damp tariff pass-through, including supplier substitution, terms-of-trade effects, pricing-to-market behavior, exchange-rate adjustment, inventory accumulation and broader macroeconomic feedback.
Even so, the results suggest that increased USMCA compliance meaningfully cushioned the inflationary effects of the 2025 tariff shock. They also show how preferential trade agreements can alter tariff transmission. If USMCA remains an effective low-tariff channel, it can mitigate some price pressures from higher tariffs while encouraging North American sourcing, supply-chain resilience and nearshoring.
If it becomes less effective—or if the ongoing USMCA review process results in tighter sourcing constraints—the same statutory tariff schedule could result in higher realized tariff burdens and stronger price pressures. Understanding this adjustment margin is therefore essential for evaluating both the true cost of tariffs and the inflation implications of future North American trade policy.
About the authors

Enrique Martínez García is an assistant vice president in the Research Department and co-director of the Global Institute at the Federal Reserve Bank of Dallas.

Ron Mau is a senior business economist at the Federal Reserve Bank of Dallas.