Tariffs increased in 2025; why did U.S. imports grow?
The U.S. average tariff rate increased from 2.9 percent in January 2025 to 14.8 percent in December, a rise of almost 12 percentage points. The surge—the largest such U.S. jump since the Smoot-Hawley tariffs at the onset of the Great Depression in 1930—led to a sharp increase in the tariff-inclusive prices that U.S. importers paid.
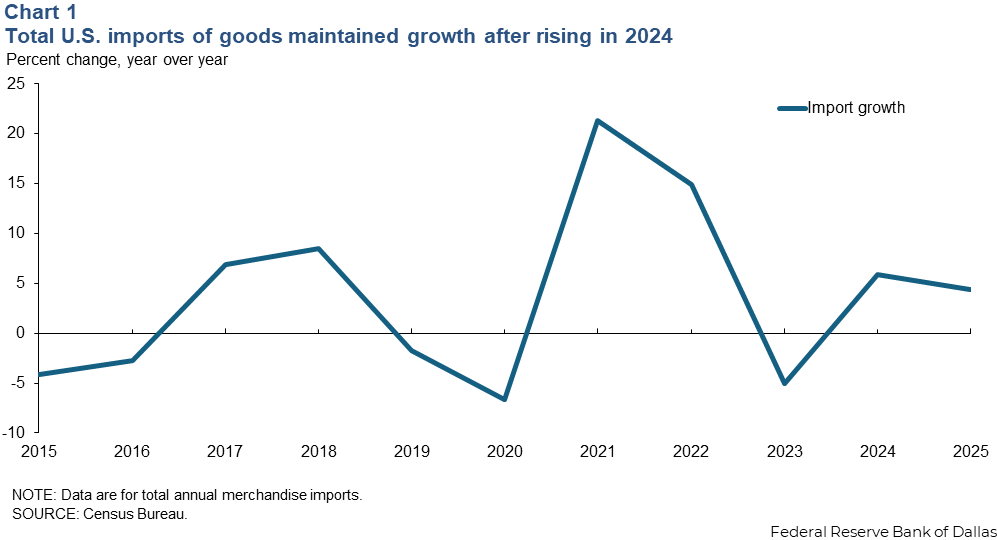
Spending on U.S. imports had been widely expected to decline sharply. It didn’t. Rather, U.S. imports grew by 4.5 percent in 2025 over 2024 levels (Chart 1).
We examine two phenomena that may explain why U.S. imports did not decline as expected. First, there was front-running—an anticipatory rush to import— especially from countries such as Ireland and Switzerland, aiming to beat tariff imposition in the early months of 2025. It is unlikely that all the front-running unwound by the end of the year.
Second, the boom in artificial intelligence (AI) equipment investment, much of which was imported, helped increase imports. Adjusting 2025 imports for front-running and heightened AI-related activity—assuming imports involving those two activities were unchanged from 2024 levels—would likely make U.S. import growth negative.
Despite the global nature of rising tariffs, the increases differed across source countries, which contributed to a reshuffling of the U.S.’s most important trading partners. We leverage this variation in tariff increases across countries, as well as variation across products, and estimate that absent other forces, U.S. imports would have fallen 12 percent owing to the tariffs.
Front-running anticipated tariffs
While the exact details of the tariff increases were not known in advance, rising tariffs were generally anticipated following U.S. national elections in November 2024, when the levies were a topic of debate. This led to front-running—countries rushing to export goods to the U.S., and U.S. importers hurriedly buying them—before tariff increases took effect.
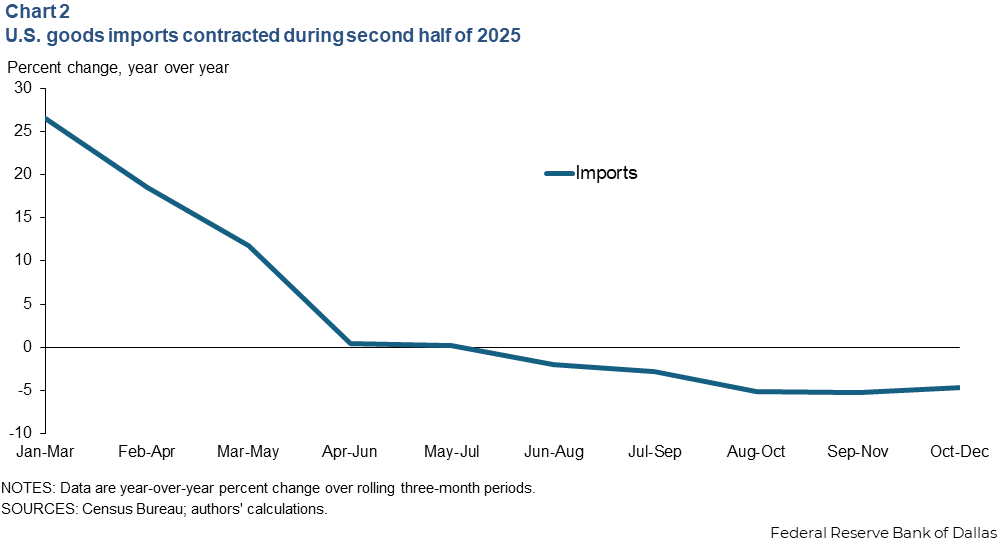
This was especially true for non-perishable and storable goods, including, for example, many pharmaceuticals and articles made of gold. As a result, for the first three months of 2025, U.S. imports were 26.5 percent higher than in January–March 2024.
In the ensuing months, import growth declined and by the final three months of 2025 the value of imports contracted relative to the final three months of 2024 (Chart 2). The import decline toward year-end likely reflects both the direct effects of tariffs and a slowdown that followed forward-pushed sales in early 2025.
Typically, with front-running, the numbers balance out within 12 months, so looking at total-year numbers might show a wash. However, this was not the case in 2025, as January to December imports of goods from Ireland (particularly pharmaceuticals) and Switzerland (notably gold) increased more than 43 percent over 2024 levels. The latest international trade data provides evidence that the payback from Swiss and Irish front-running extended into 2026. They show January-through-April 2026 imports from these two countries declined 28 percent from the same period in 2024.
Had imports from these two countries remained at 2024 levels, U.S. import growth in 2025 would have been only half as large, suggesting front-running as a contributing factor to U.S. import growth in 2025.
AI equipment investment booms
The recent AI boom has supported surging data center construction investment in related computing hardware, such as graphics processing units. Much of the computing equipment has been imported via Mexico.
Imports for the “office machines” North American Industry Classification System (NAICS) category—which covers goods such as computers and computer peripherals used in data center construction—grew 68.3 percent in 2025 relative to 2024 levels (Table 1).
| Table 1: U.S. imports of AI-related equipment surges, eclipsing other trade | |
| Import change (percent) | |
| Total Imports | 4.57 |
| Non-Office Machines | 0.19 |
| Office Machines | 68.28 |
One way to see the importance of this boom is by accounting for its contribution to growth of total U.S. imports. Had imports of office machines in 2025 remained unchanged from 2024 levels, overall U.S. import growth would have been essentially zero.
Tariffs contributed to shifting U.S. import source countries
The 2025 tariffs were applied differentially across countries. “Weighted-mean” tariffs—the weighted average tariff on each country using 2024 product import shares as weights—provide insight on these levies’ impact.
For China, the weighted-mean tariff, rose from 12 percent in January to a peak of 46 percent in May before dropping to 30 percent in December. Tariffs on imports from Vietnam also rose, from 4 percent to 18 percent overall.
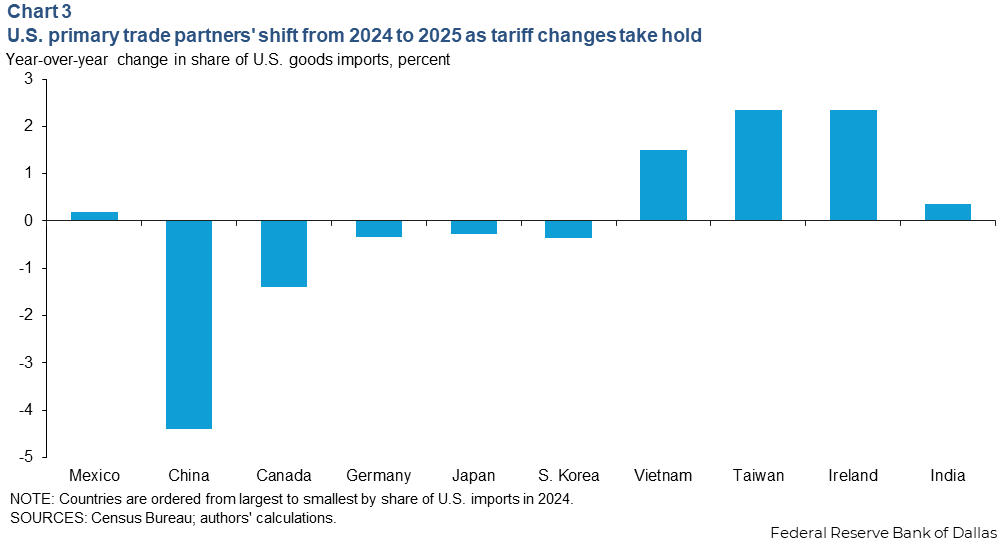
Given the uneven imposition of tariffs across countries, it is perhaps not surprising that the share of U.S. imports from source countries showed unusually large shifts from 2024 to 2025. The dollar value of U.S. imports from China plummeted 40 percent, and the share of U.S. imports from China fell by more than 4 percentage points, from 13.4 percent in 2024 to 9.0 percent in 2025.
By contrast, the share of U.S. imports from Vietnam increased by about 1.5 percent. Overall, the standard deviation of the year-to-year change in the share of U.S. imports (across countries) quadrupled between 2023–24 and 2024–25. Countries such as Vietnam, Taiwan, India and Mexico picked up much of the trade that China left behind (Chart 3). (Front-running seems the likeliest explanation for the increase in the U.S. import share from Ireland.) Most of these countries experienced smaller tariff increases than China.
Statistical analysis of how tariffs affected imports
How have higher tariffs affected import growth? To measure this, we first estimate the sensitivity—what economists call elasticity—of imports to changes in tariffs. Our data on tariffs and imports are at a fine level of detail, with 388 distinct categories of imports (six-digit NAICs), and covering 50 of the largest U.S. trading partners from October–December 2025 relative to October–December 2024.
The analysis compares import growth rates across country-product categories with larger relative to smaller tariff increases, controlling for product-specific import growth and country-specific import growth. We obtain an elasticity of -1.6—if tariffs increase by 1 percentage point, all else equal, imports will decline by 1.6 percent.
The change in tariff rates over the full year of 2024 compared with the full year of 2025 for each product-by-country source is scaled by our estimated elasticity to calculate the change in import activity attributable to tariffs, absent other effects. These individual product-country estimated changes are aggregated to create an average of import growth rates, weighted by each country-product category’s share of total January-December 2024 imports.
We obtain an overall estimate of -12.3 percent, which means that, all else equal, the increase in tariffs contributed to an import decline of 12.3 percent in 2025 relative to 2024. Put differently, in the absence of the AI spending boom, front-running and other forces affecting international trade, the increase in tariffs in 2025 would have led to about a 12 percent reduction in U.S. imports.
The import increase in 2025 is testimony to the importance of non-tariff forces, such as the boom in AI and other macroeconomic forces.
About the authors

Ben Kim is a research analyst in the Research Department at the Federal Reserve Bank of Dallas.

Tucker Smith is a research economist in the Research Department of the Federal Reserve Bank of Dallas.

Kei-Mu Yi is a senior vice president and co-director of the Global Institute at the Federal Reserve Bank of Dallas.