
Recent inflation surges have modestly affected long-term expectations
U.S. Consumer Price Index (CPI) inflation is at an almost 40-year high. Improvements in Federal Reserve credibility over the last 40 years have ensured that inflation expectations, particularly long-term inflation expectations, have so far remained well-anchored despite surging current inflation.
Chart 1 plots year-over-year headline CPI inflation, as well as the one-year inflation expectation and the 5-year, 5-year-forward expectations drawn from data published by the Federal Reserve Bank of Cleveland.
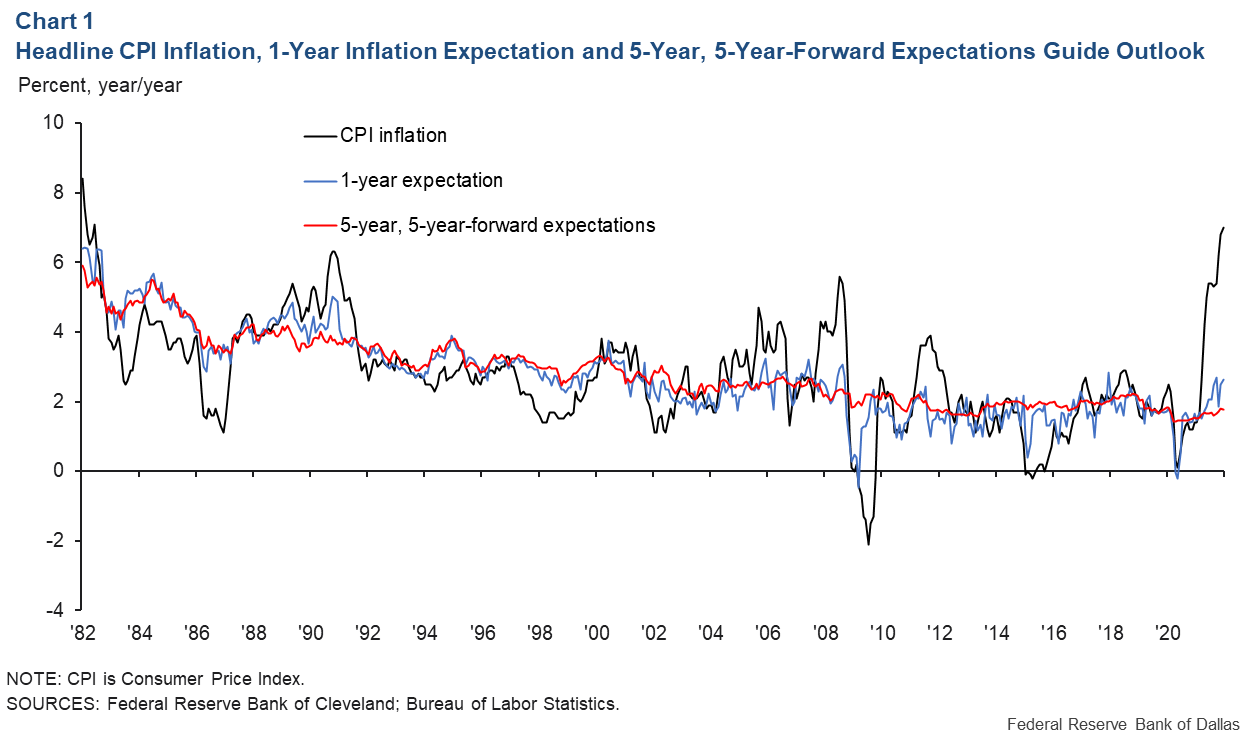
The one-year reflects the expectation—derived from a Cleveland Fed model that includes both market-based and survey-based data of inflation and inflation expectations—over the next year. The 5-year, 5-year-forward expectations measure the expected rate of inflation over a five-year period beginning five years from now. Using five-year and 10-year expected inflation rates, it is possible to back out this 5-year, 5-year-forward rate.
Current observed inflation has increased rapidly over the past year and is at its highest since the beginning of the sample period, in 1982, and the one-year expectation is increasing and has rocketed past the Fed’s 2 percent target in recent months. However, the 5-year, 5-year-forward has remained in a tight range around the 2 percent target since the mid-2000s.
As current observed inflation has increased by more than 5 percentage points in the past year, and the one-year expectation has increased by more than 1 percentage point, the 5-year, 5-year-forward has only increased by around 25 basis points (0.25 percentage points) and remains below the 2 percent target.
Measuring the anchoring of inflation expectations
One way to gauge the anchoring of inflation expectations is to calculate the responsiveness of expected inflation in the next few years to current unexpected inflation. If expectations are well-anchored, the response will be minimal.
We would like to measure how unexpected inflation over the past year—the difference between year-over-year CPI inflation in the current month and the one-year expectation from the same month last year—affects the difference between inflation expectations in the current month and those from the same month last year.
Ideally, expectations from last year and this year would be similar. A 5-year, 5-year-forward today would be compared with a 5-year, 6-year-forward last year, since both measure expected inflation over a five-year period starting five years from today.
The Cleveland Fed inflation expectation data also contain estimates of one-year, two-year, three-year— all the way up to 30-year—inflation expectations. The data are available monthly, starting in January 1982. With this unique dataset, we can use the five- and 10-year expectations to calculate a 5-year, 5-year-forward this month and the six- and 11-year expectations to calculate a 5-year, 6-year-forward for the same month last year.
The difference between them is the revision in the 5-year-forward inflation expectations over the past year. We can also calculate the revisions in inflation expected over the next year—the one-year expectation this month minus the 1-year, 1-year forward expectation from the same month last year.
Current unexpected inflation and the revisions in both short- and long-run inflation expectations are shown in Chart 2.
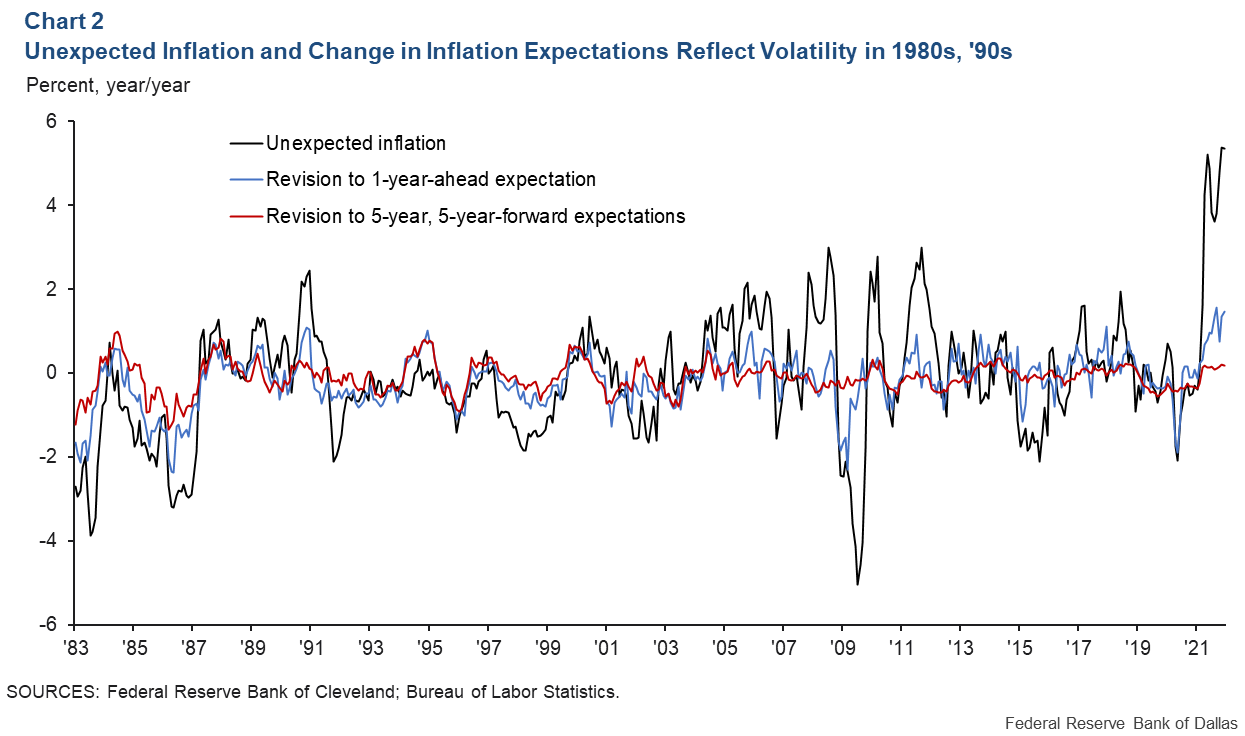
In the 1980s and 1990s, revisions to both short- and long-term expectations were highly correlated with unexpected inflation, and revisions to long-term expectations were nearly as volatile as revisions to short-run expectations.
Since the turn of the century, revisions to short-term expectations have remained volatile and highly correlated with unexpected inflation, but revisions to long-term expectations have been small and uncorrelated with current inflation.
Anchoring during the period of unconventional monetary policy
Ten years ago, in a Dallas Fed Economic Letter, I measured the anchoring of inflation expectations in response to a surge in oil and other commodity prices in 2011 that led to a surprise jump in headline CPI inflation.
The article concluded that in the decades since then-Fed Chairman Paul Volcker’s disinflation campaign in the early 1980s, inflation expectations in the United States became much better-anchored. Using ordinary least-squares regressions, I regressed the change in long-term expectations on current unexpected inflation. The data were reviewed by decade—the 1980s, the 1990s and the 2000s.
In the data from the 1980s, a 1-percentage-point increase in unexpected inflation led to a 28-basis-point increase in the expectations for inflation over a window of five years, five years from now.
In the 1990s, the same 1-percentage-point increase in unexpected inflation would lead to an 18-basis-point increase in long-forward expectations, and in the years between 2000 and 2008, the change was only 4 basis points.
That article was written in the wake of the Great Recession, and the Fed’s use of unconventional monetary policy only made up a few years of observations at the end of the sample. Now, with the benefit of an extra 10 years of data, we can ask whether U.S. inflation expectations have remained anchored during the more-recent period of the zero lower bound (the federal funds rate at near 0) and unconventional monetary policy (involving Fed purchases of Treasuries and mortgage-backed securities).
Using data from 2009 to 2021, the estimated effect of unexpected inflation on long-forward expectations is only 4.8 basis points. From this we would conclude that the improvements in the anchoring of inflation expectations that took place over the decades between the Volcker disinflation and the Great Recession continued over the past decade, the period of unconventional monetary policy.
The current surge in inflation and expectations
Unexpected inflation is currently higher than at any point in our sample, going back to 1983. What effect is that having on long-term inflation expectations? Chart 3 plots the last 10 years of unexpected inflation and the revisions to short- and long-term inflation expectations from Chart 2.
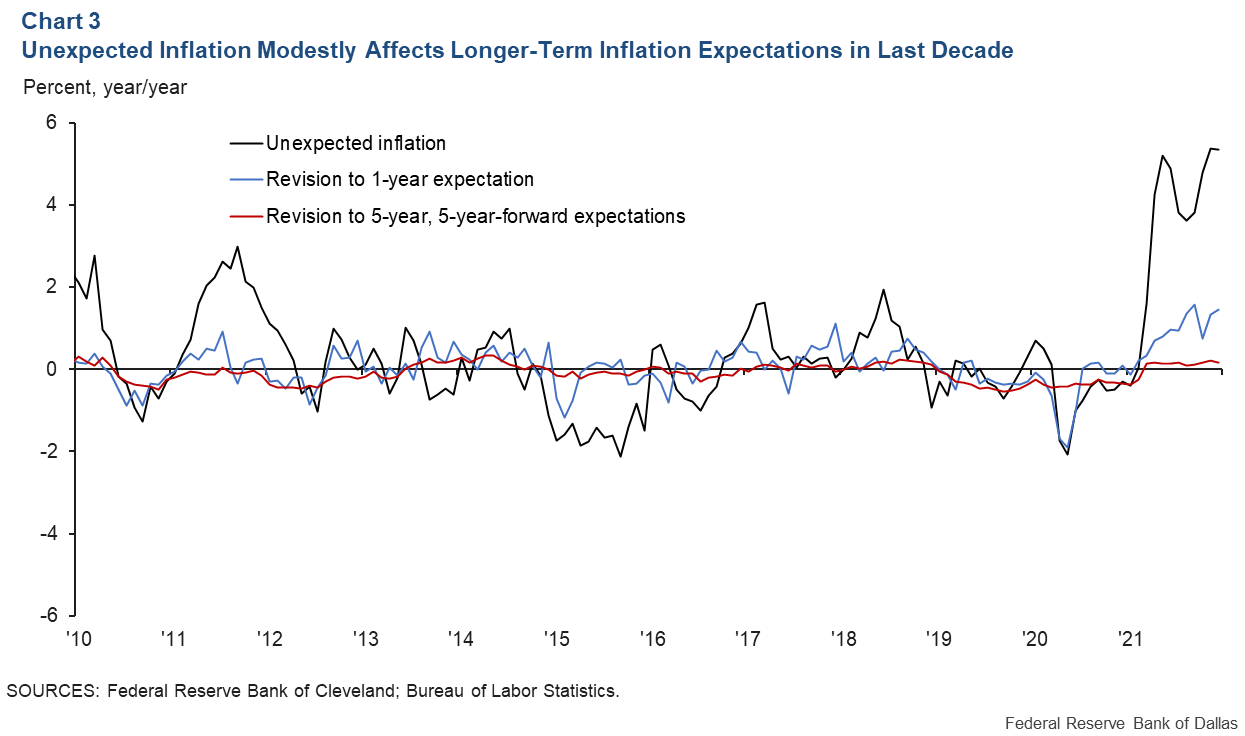
Revisions for inflation over the next year are the highest they’ve been over the past decade and are trending upward, indicating that current unexpected inflation is leading to an increase in expectations for inflation over the near term. However, revisions in expectations for inflation beginning in five years have been very stable over the past decade and have remained within a range of plus or minus 30 basis points. Despite the historically high unexpected inflation, current revisions to long-term inflation expectations remain around 20 basis points, similar to the revisions in 2018 and slightly smaller than revisions in 2014.
About the Author

Davis is an economic policy advisor and senior economist in the Research Department at the Federal Reserve Bank of Dallas.
The views expressed are those of the authors and should not be attributed to the Federal Reserve Bank of Dallas or the Federal Reserve System.