
Bubble thought: What beliefs can reveal about housing market risks
Survey-based forecast data on home price growth are a surer indicator of housing market exuberance than traditional valuation ratios, such as price-to-income or price-to-rent.
Our recent research draws on monthly data from the University of Michigan Survey of Consumers and the Federal Reserve Bank of New York’s Survey of Consumer Expectations. These surveys offer a distinctive, forward-looking lens especially well suited for identifying speculative dynamics evidenced by shifting expectations.
Two major episodes of widespread exuberance in the U.S. housing market since the Global Financial Crisis of 2007–09 emerge: between 2016 and 2018 and again during the pandemic-era boom in 2021.
These results highlight the potential of expectations-based indicators as timely tools to monitor the housing market and analyze financial stability.
Spotting a housing bubble before it bursts is challenging
Despite significant progress, most empirical tools used to monitor asset market exuberance rely on backward-looking indicators and assumptions about which fundamentals should be included. Variables such as income or rents are difficult to measure consistently, are subject to publication lags and often vary greatly in quality and coverage across regions and countries.
Moreover, assumptions about how these fundamentals influence house prices are frequently debated, reflecting empirical vulnerabilities often involving variables that are omitted or misspecified.
Rather than modeling intrinsic housing values directly, we consider beliefs. This method examines how households expect prices to evolve and investigates what happens when those expectations systematically diverge from actual outcomes.
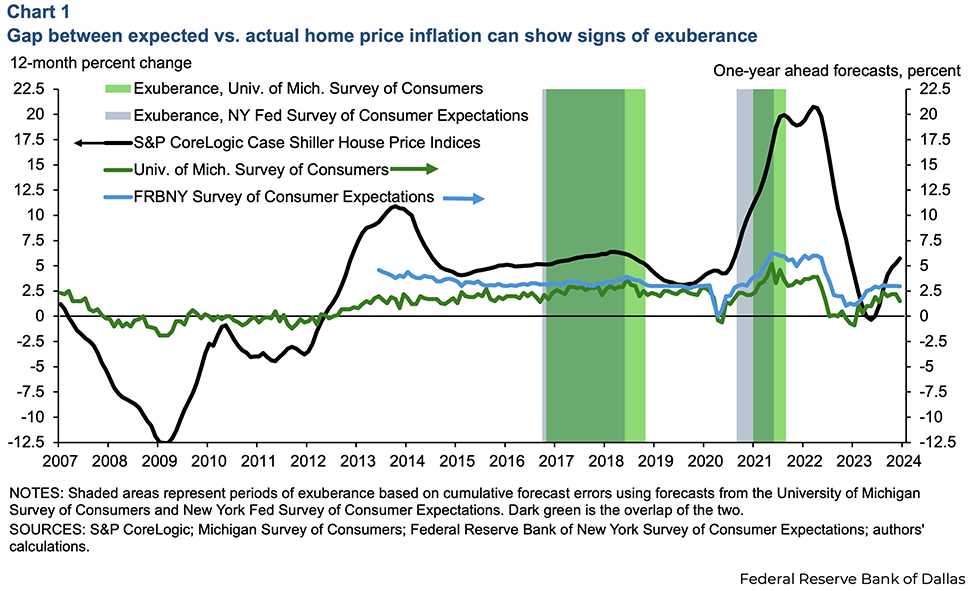
During booms, expectations often trail actual house price growth, producing persistent forecast errors. Such cumulative underpredictions of price increases serve as a signal of building exuberance, as shown by the divergence between house prices (measured by the S&P CoreLogic Case-Shiller Home Price Indices) and one-year-ahead household price forecasts (Chart 1).
An alternative to survey data is financial market information, such as housing futures prices. Previous Dallas Fed research has shown the value of such instruments as signals of shifting market perceptions. However, due to limited liquidity and market depth, these financial indicators are less suited to the type of systematic, expectation-based detection of exuberance pursued here.
Expectations critically important part of assessment
Traditional approaches to detecting bubbles rely on comparing prices to fundamentals such as income, rents or valuation ratios (price-to-income or price-to-rent). Yet, these benchmarks are difficult to precisely observe in real time and may lack proper geographic representation.
Expectations, by contrast, offer a forward-looking lens rooted in households’ beliefs. In rational bubble theory, asset prices may rise in a self-fulfilling way even when participants understand a bust is possible. Because households factor in the chance of collapse, they tend to underpredict actual price growth during very rapid expansions. This systematic bias leads to cumulative forecast errors that grow very rapidly. These errors serve as a fever reading, a telltale symptom of the underlying speculative exuberance.
Importantly, this statistical approach aimed at tracking such fevers is separate from the structure of economic fundamentals of the housing market, circumventing concerns about model misspecification and omitted variable bias. This approach looks for periods when forecast errors show patterns over time and heterogeneity across the distribution consistent with self-reinforcing momentum that fundamentals alone could not explain.
Two episodes of exuberance show tendency
A pair of episodes in the post-Global Financial Crisis period exhibit widespread speculative dynamics based on U.S. survey-based cumulative forecast error data.
- A silent bubble (2016–18) occurred amid accelerating strong price growth almost a decade after the Global Financial Crisis. The bubble was accompanied by accommodative financial conditions and rising optimism, but it drew little attention at the time.
- The pandemic-era boom (2021) occurred amid fiscal transfers, low interest rates and tight housing supply, further strained by U.S. households adapting to remote work and shifting location preferences. Our indicators show this burst of exuberance subsided by September 2021 across all demographic and socioeconomic groups, well before house-price growth began to cool in mid-2022.
Notably, both survey sources, the University of Michigan and the New York Fed, identify essentially the same episodes of exuberance, confirming the robustness of our findings across independent datasets.
Reviewing the monetary policy channel
Chart 2 places both episodes of exuberance in the context of short-term nominal interest rates, forward-looking private forecasts from Consensus Economics, Federal Open Market Committee (FOMC) projections of appropriate policy (known as the Summary of Economic Projections) and the Federal Reserve Board of Governors’ Financial Conditions Index.
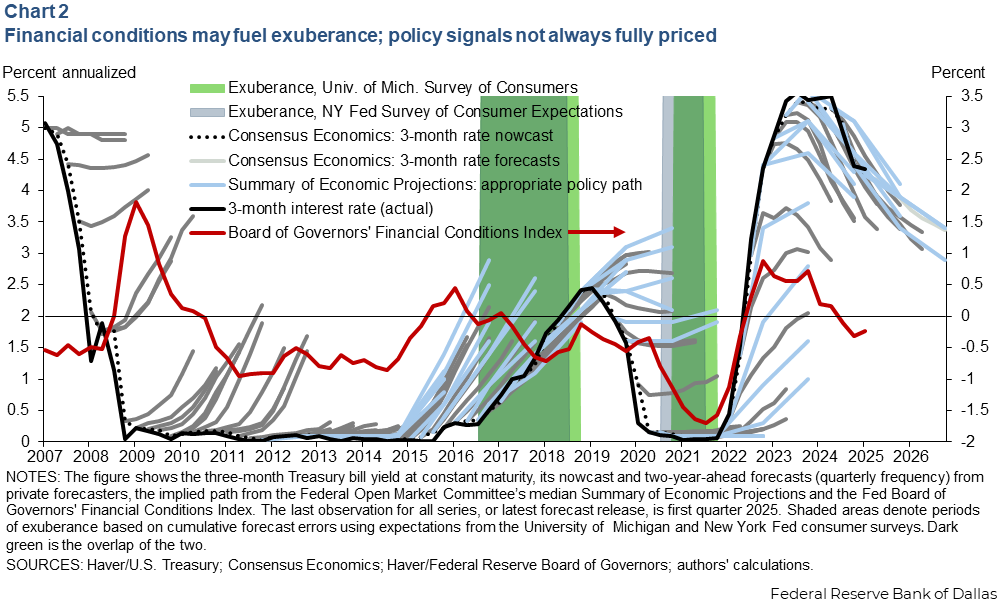
Unprecedented monetary accommodation, including near-zero interest rates and multiple rounds of quantitative easing, followed the Global Financial Crisis. It contributed to a broad and sustained rise in asset valuations, the so-called “everything bubble,” including housing markets.
The Board of Governors’ index captures broad financial conditions, summarizing the cumulative impact of changes in seven financial variables over the previous three years, to assess gross domestic product growth in the subsequent year. The variables include equity prices, bond yields, mortgage rates, the dollar and even house prices.
Notably, shifts in monetary policy perceptions do not always translate into tighter financial conditions. Following the Global Financial Crisis, from 2009–12, financial conditions remained broadly accommodative even as forward guidance about a low-for-long policy rate stance struggled to anchor expectations that interest rates would hew close to the effective lower-bound near zero.
These perceptions began to shift with the Fed’s first tentative rate hike in December 2015, which helped shape expectations for faster policy normalization. However, it did not fully materialize. Policy was paused until December 2016, when a more sustained tightening began.
While the initial move and guidance contributed to a modest financial tightening (as reflected in the Board of Governors’ index, red line in Chart 2), subsequent rate increases aligned more closely with private expectations and were accompanied by an overall easing of financial conditions. As a result, rising short-term rates imposed little drag on economic activity, and this period coincided with the first clear burst of housing market exuberance after the Global Financial Crisis. This episode also illustrates that financial conditions can loosen even during active monetary tightening.
Similar patterns appear to resurface in the pandemic-era expansion. Once again, accommodative monetary and fiscal policies, paired with constrained housing supply, helped reignite house price growth. A further loosening of financial conditions followed, this time more clearly aligned with the Federal Reserve’s explicit and credible commitment to keeping rates at the effective lower-bound. This low-for-long guidance appears to have been more effectively transmitted to financial markets.A key difference between the two periods, however, lies in the timing of exuberance relative to the monetary policy cycle. During the 2016–18 episode, exuberance appears to have faded around the time policy rates peaked and expectations for future easing emerged. In contrast, our expectations-based indicators suggest that during the pandemic-era boom, exuberance began to subside before the policy tightening cycle began in March 2022.
Two key lessons emerge. First, the pass-through from expected rates to broader financial conditions can be limited. The introduction in 2012 of the FOMC’s Summary of Economic Projections fell short of fully communicating the likely future policy path.
Second, when exuberance takes hold—notably in housing markets—looser financial conditions often accompany and reinforce it. This dynamic can run counter to the goals of monetary policy.
Moreover, because the Board of Governors’ index incorporates asset prices such as house prices, the very housing booms being analyzed may contribute to the measured easing of financial conditions independently of policy stance or monetary policy transmission.
Thus, household expectations may change market views for a variety of reasons and can contribute to deflating a bubble, most notably in response to anticipated macroeconomic adjustments. Such an anticipatory movement followed the pandemic-era rebound and inflation surge before a signal of credible policy change or the policy actually changing.
Sentiment offers a marker of exuberance
We also examined the Fannie Mae Home Purchase Sentiment Index. This composite index aggregates consumer views on home buying, timing of buying and selling, expectations for home prices and mortgage rates, and household finances (job security and income changes). Thus, it combines perceptions about fundamental and speculative factors in the housing market.
Sentiment rose markedly during both episodes of exuberance, then declined sharply at the onset of the pandemic in early 2020 and again after mid-2021 (Chart 3). Notably, exuberance tends to occur not only amid rising sentiment, riding a wave of optimism. but also when financial conditions as measured by the Board of Governors’ index are clearly easing.
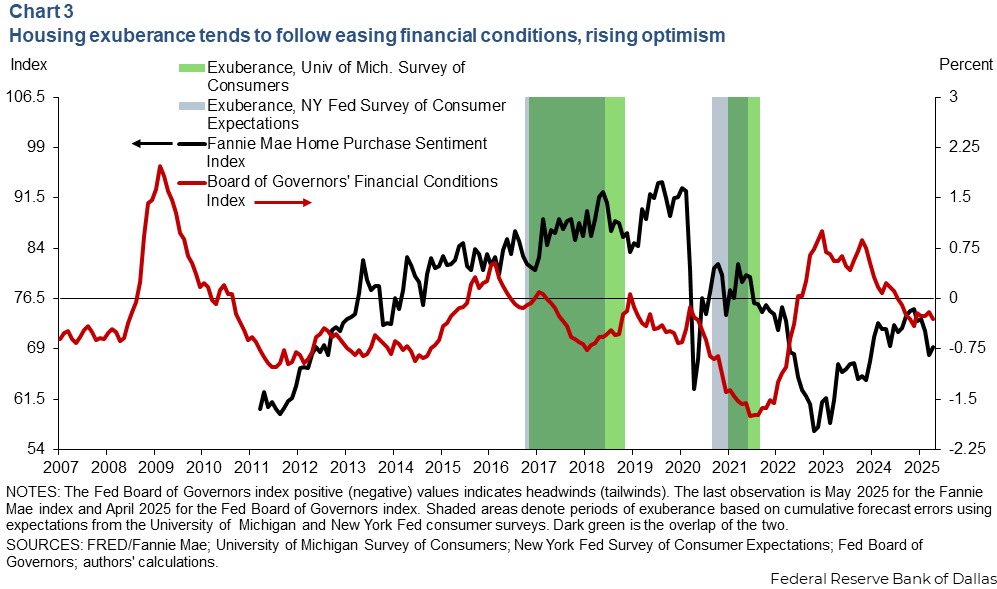
An exception is 2019, when monetary policy shifted, providing accommodation with lower rates and a downward revision to the expected policy path. Sentiment remained elevated even as concerns about the outlook began to surface.
Patterns in the survey-based forecast data suggest a more nuanced interpretation. While rising sentiment and financial easing often accompany the formation of housing bubbles, they do not necessarily determine the nature of the underlying risks or anticipate subsequent market corrections.
Moreover, sentiment typically adjusts only after conditions visibly deteriorate, sometimes shifting in response to factors unrelated to speculative dynamics. Sentiment (like financial conditions) is most informative when viewed alongside direct measures of exuberance.
Exuberance is a broad-based phenomenon
Exuberance doesn’t appear limited to a single demographic or income group. Instead, forecast errors show similar patterns across education levels, marital status, income brackets and investment behaviors. The same two distinct periods of exuberance, 2016–2018 and pandemic-era 2021, are identified across both survey datasets and across socioeconomic groups (Chart 4).
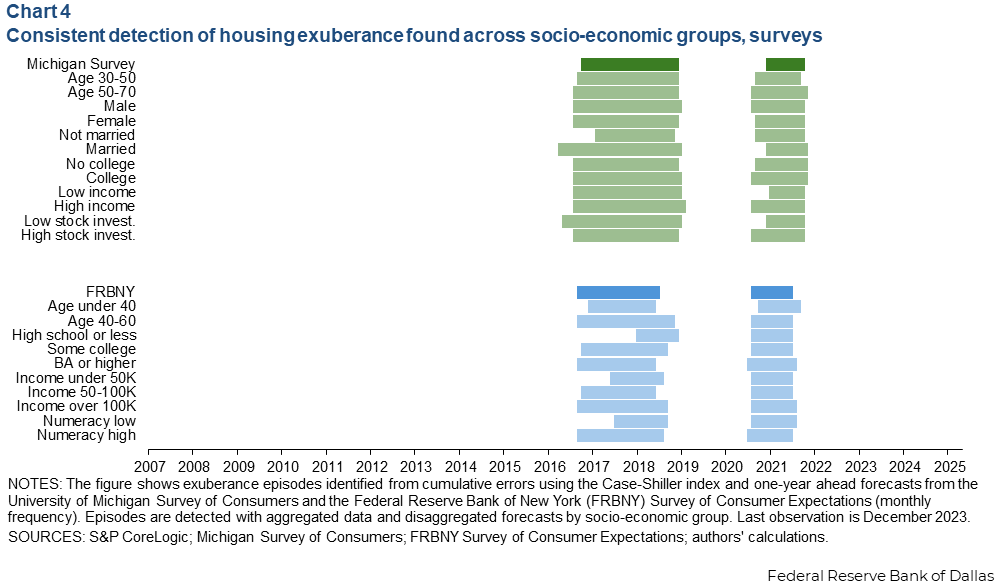
This widespread quality of belief-driven dynamics highlights the systemic nature of recent speculative housing booms. The implication for policymakers is clear: Speculative risk is not confined to isolated segments but can encompass entire markets.
Implications for financial stability
Survey-based expectations offer a powerful addition to the financial stability toolkit and pose several advantages.
- Timeliness: Expectation errors can shift before fundamentals are observed, providing early signals.
- Granularity: Household-level data allow targeted surveillance across groups.
- Model independence: Surveys avoid reliance on assumptions about equilibrium price levels and fundamentals.
For central banks, regulators and market analysts, this offers new insight into the psychological and behavioral drivers of housing risk available for real-time monitoring.
Expectation-based indicators offer lessons on early detection
Recent U.S. housing cycles offer a sobering reminder that bubbles may form quietly, gaining traction before they show up in gaps between prices and fundamental-based estimated values. In recent work we show that expectation-based measures—grounded in what households believe—can detect such dynamics early and robustly.
The challenge for policy is not only to measure market outcomes, but to understand the narratives and expectations driving them. Expectation-based indicators, especially when combined with other, ancillary evidence, provide a valuable lens for doing just that. They may not prevent bubbles, but they can help identify them before it is too late.
About the authors

Enrique Martínez García is an assistant vice president in the Research Department and co-director of the Global Institute at the Federal Reserve Bank of Dallas.

Efthymios Pavlidis is a professor of economics at Lancaster University Management School in Lancaster, U.K.