USMCA trade outlook matters for the U.S., not just for Canada and Mexico
The review and ongoing renegotiation of the U.S.–Mexico–Canada Agreement (USMCA) could reshape North American trade, creating winners and losers among countries, U.S. states and industries.
We find that various redesign options will have differential economic effects. Tighter rules of origin, higher tariffs on noncompliant trade, removal of USMCA preferences and regional tariff coordination would all redirect supply chains and support some reshoring, but through different channels and with varying aggregate and distributional effects.
Using a quantitative trade model developed by Ana Maria Santacreu, Michael Sposi and Jing Zhang, we find that the key question is not simply what a USMCA redesign aims to achieve, but how it does so and at what cost. Tighter rules of origin are esppecially costly because they constrain global sourcing and add compliance burdens, including on U.S. firms.
Removing USMCA preferences imposes large losses on Canada and Mexico, underscoring the asymmetric value of the agreement in a higher U.S. tariff environment. Those increased tariffs on noncompliant trade have smaller effects because adherence to USMCA as a workaround to rising tariffs has gained prominence since 2025. Meanwhile, targeted or broader tariff coordination (a Fortress North America approach) can at least cushion some losses through tariff-revenue gains.
For the U.S., aggregate effects may look modest. However, state and industry outcomes vary sharply under various scenarios. These short-run estimates capture first-round effects before firms shift supply chains, workers reallocate across sectors, and capital and investment adjust.
A higher-tariff baseline changes the USMCA calculus
The USMCA review doesn’t begin in a low-tariff world (Table 1). The table shows the January 2025 to January 2026 change in the import-weighted average U.S. tariff rates across major partners and sectors.
| Percentage-point change in import-weighted average U.S. tariff rates, January 2025 to January 2026 | |||||||||
| Mexico | Canada | Brazil | EU | S. Korea | Japan | India | China | ROW | |
| Agriculture | 2.1 | 1.7 | 14.3 | 13.6 | 14.9 | 14.5 | 49.4 | 19.6 | 8.3 |
| Mining | 0.0 | 0.9 | 1.3 | 11.4 | 4.1 | 2.5 | 29.9 | 13.0 | 0.2 |
| Food and tobacco | 1.0 | 2.3 | 16.7 | 11.0 | 13.5 | 9.8 | 44.1 | 19.2 | 10.4 |
| Textiles and apparel | 3.0 | 6.4 | 48.5 | 7.4 | 14.9 | 10.3 | 50.0 | 20.0 | 18.0 |
| Wood | 6.6 | 5.3 | 16.8 | 7.4 | 22.3 | 10.8 | 46.9 | 19.0 | 7.0 |
| Paper and printing | 2.3 | 1.2 | 7.7 | 13.5 | 15.0 | 14.4 | 49.9 | 20.7 | 16.8 |
| Refined products | 2.0 | 1.8 | 7.3 | 4.5 | 6.3 | 9.7 | 18.4 | 20.0 | 8.4 |
| Chemicals and pharma | 1.8 | 1.9 | 33.2 | 1.9 | 9.8 | 5.6 | 9.8 | 13.9 | 4.0 |
| Nonmetal minerals | 1.9 | 2.0 | 32.8 | 10.6 | 14.5 | 12.0 | 49.9 | 20.5 | 16.9 |
| Metals | 18.8 | 27.2 | 32.7 | 21.8 | 27.1 | 19.6 | 47.3 | 30.8 | 14.8 |
| Machinery | 9.6 | 6.7 | 41.5 | 9.3 | 9.4 | 10.1 | 45.3 | 22.6 | 9.7 |
| Computers and electronics | 4.2 | 7.6 | 32.6 | 8.2 | 6.0 | 7.2 | 19.3 | 21.8 | 12.4 |
| Transportation equipment | 7.0 | 3.2 | 15.8 | 9.1 | 14.7 | 11.7 | 34.5 | 30.5 | 14.8 |
| Furniture and other | 6.6 | 7.8 | 47.0 | 12.3 | 14.4 | 12.9 | 49.6 | 21.3 | 17.7 |
| NOTES: The table shows the January 2025–January 2026 change in import-weighted average U.S. applied ad valorem tariff rates, in percentage points, by source economy and industry bucket. Rates are built from WTO–IMF Tariff Tracker HS6 tariff-action data, mapped to NAICS6 industries using the U.S. Census HTS10–NAICS6 concordance and aggregated with fixed 2024 U.S. import weights. HS6 values are allocated to NAICS6 using HTS10 line-count shares. WTO-IMF Tariff Tracker is a joint initiative of the World Trade Organization and the International Monetary Fund. HS is the Harmonized System and HTS is the Harmonized Tariff Schedule, nomenclature for tariff rates and goods. NAICS6 denotes 6-digit codes for industries in the North American Industry Classification System. EU is the European Union; rest of the world (ROW) is constructed directly from remaining individual-country partners. Darker shading indicates larger tariff increases. SOURCES: Authors' calculations using WTO–IMF Tariff Tracker data, U.S. Census HTS10–NAICS6 concordance and 2024 U.S. import values. |
|||||||||
January 2026 is not a definitive benchmark, but rather the last full month before the Supreme Court overturned some tariffs imposed under the International Emergency Economic Powers Act. Authorities have since moved to replace them. The benchmark captures the consequences of the large, uneven shock that occurred as the review process began.
The shock changed the USMCA calculus in two ways. First, it raised the value of claiming preferential treatment under the agreement. In a low-tariff environment, some firms could lawfully ship under non-preferential or most-favored nation rules rather than incur the sourcing, certification and documentation costs required to claim USMCA preferences. Once non-USMCA tariffs rose, that fallback option became more expensive, making preferential access more valuable and USMCA conditionality more binding.
Second, higher tariffs on goods from China, India, Brazil and on several sectors create incentives for trade diversion, potentially favoring USMCA partners even if the global effects are costly overall.
This tariff shock reflects a broader shift in U.S. trade policy toward resilience, de-risking from China and broader tariff use as both an industrial-policy tool and revenue source. The free-trade logic of the North American Free Trade Agreement (NAFTA), predecessor to USMCA, has given way under the USMCA to greater emphasis on conditional market access. As Nobel laureate Paul Krugman’s early work on regional blocs suggests, regionalization can generate gains for members, though welfare effects depend on design, the extent of trade diversion toward less efficient regional suppliers and outsider responses. Higher and more uneven tariffs outside USMCA therefore change the baseline for evaluating any redesign.
Tracing tariff effects across countries, states and sectors
To evaluate this landscape, we need a model that captures heterogeneity across countries, industries and U.S. states. The Santacreu-Sposi-Zhang framework maps country- and sector-specific tariffs into real income, tariff revenue and consumption (Chart 1).
NOTES: The map shows the distributional effects on private real consumption across U.S. states, the U.S.’s eight largest trading partners and the rest of the world. Estimates capture the immediate impact of country- and sector-specific tariffs as of January 2026, before the Supreme Court overturned International Emergency Economic Powers Act tariffs. The change is relative to a January 2025 baseline. The model assumes tariff revenues are rebated to households as lump-sum transfers with limited foreign retaliation. Results primarily reflect the effects of unilateral U.S. tariff changes.
SOURCES: "What Determines State Heterogeneity in Response to U.S. Tariff Changes?" by Ana Maria Santacreu, Michael Sposi and Jing Zhang, Federal Reserve Bank of Chicago, Working Paper no. 2023-09, revised 2025; authors’ calculations.
The largest negative impacts fall on Mexico, Canada and, to a lesser extent, China. Mexico and Canada are uniquely exposed because their integration with the U.S. economy is deep and asymmetric. In 2024, roughly 83 percent of Mexico’s exports and 76 percent of Canada’s merchandise exports went to the U.S., while Mexico and Canada together absorbed about one-third of U.S. goods exports. Access to the U.S. market thus matters much more for Mexico and Canada than access to either market matters for the U.S. economy.
Mexico and Canada generally faced smaller tariff increases because USMCA-compliant trade preserved their preferential standing. Firms responded by routing even more trade through USMCA channels, mitigating general tariff exposure but incurring compliance costs and, over time, potentially shifting supply chains toward costlier regional sourcing.
China was affected differently. Tariff increases are larger in sectors where U.S. policy has been most focused, creating scope for trade diversion toward alternative suppliers, including those in North America.
For the U.S. aggregate, the model effect is close to a wash, though there is substantial state- and industry-level variation. Tariffs can help import-competing industries while hurting those reliant on imported inputs. Because states differ in industry composition and supply-chain exposure, the same shock can generate very different local outcomes, as seen in Chart 1. This Santacreu-Sposi-Zhang framework is also useful for evaluating alternative USMCA scenarios in a higher-tariff world.
Terms of trade and revenue gains soften the U.S. aggregate effect
Chart 2 decomposes the January 2026 consumption effect into real factor income (derived from the inputs to production) and tariff revenue. Higher tariffs reduce real factor income by making imports more expensive and changing production and consumption decisions. But tariffs also generate revenue that, when rebated to U.S. households, can offset part of the income loss.
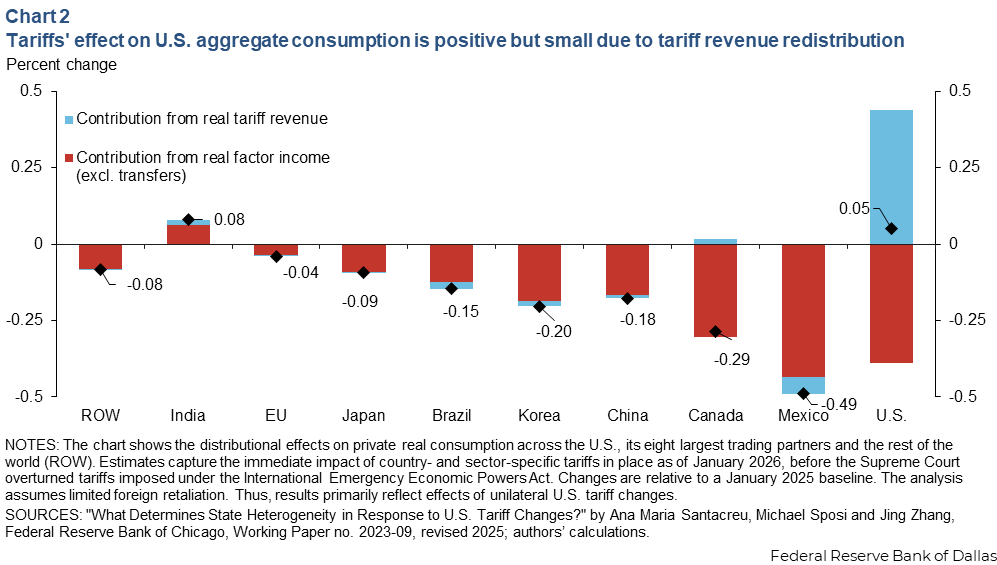
The key mechanism is the terms-of-trade channel. Absent foreign retaliation, unilateral tariff imposition depends on how easily U.S. buyers can switch suppliers and foreign producers can sell elsewhere. Because the U.S. is a large market, exporters may lower pre-tariff prices to protect market share, shifting part of the burden abroad. In the extreme Metzler-paradox case, the foreign price falls so much that the tariff-inclusive domestic price declines. More typically, tariffs still raise U.S. prices and reduce real factor income.
That is why tariff revenue matters. Even when part of the burden is shifted abroad, tariffs still create distortions and higher import costs. The U.S. can partly offset those losses through revenue gains, depending on how revenue is used. Mexico, Canada and other partners do not receive the same offset from tariff revenue as the U.S. does and end up absorbing part of the tariff burden without such a cushion.
The key lesson is that a small U.S. aggregate effect does not mean tariffs are costless. It reflects offsetting forces: lower real factor income losses from partial cost sharing (improved terms of trade) and higher tariff revenue. A near-wash nationally can still involve meaningful redistribution across states and industries.
Conditionality can push regionalization, but at a cost
Chart 3 evaluates five USMCA-related scenarios against the January 2026 higher-non-USMCA-tariff baseline: tighter rules of origin, removal of USMCA preferences, higher tariffs on noncompliant goods, targeted coordination vis-à-vis China and broader external tariff coordination. The exercise compares policy levers that could reshape North American integration and aligns with recent federal government priorities involving stronger origin rules, non-market-economy content, transshipment and offshoring.
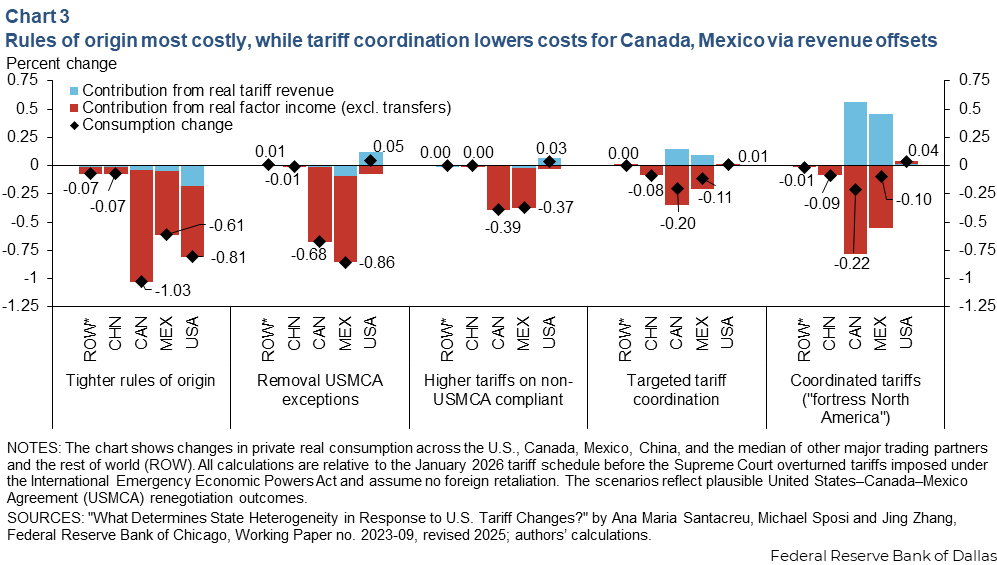
The first three scenarios (tighter rules of origin, removal of USMCA exceptions and higher tariffs on non-USMCA compliant trade) operate through USMCA conditionality. Exporters and importers can comply with rules of origin to obtain preferences under the USMCA or pay the fallback tariff and retain sourcing flexibility. When most-favored nation status and other non-preferential tariffs were low, many firms could rationally choose flexibility. The 2025 U.S. tariff increases boosted the cost of noncompliance, raising the value of preferential access under USMCA.
Tightening rules of origin is the most direct way to require more North American content. Because rules of origin constrain sourcing and documentation as an alternative to statutory tariffs, we model a meaningful tightening as a 25-percentage-point tariff-equivalent increase in non-tariff barriers on goods imported by the U.S., Canada and Mexico from outside USMCA coverage area.
Firms are pushed toward North American inputs, which may support regionalization but raises costs when lower-cost non-USMCA suppliers are displaced. In the model, consumption falls about 1.03 percent in Canada, 0.61 percent in Mexico and 0.81 percent in the U.S. Unlike tariffs, stricter origin rules raise costs without generating revenue to offset losses.
Evidence supports that logic. Earlier NAFTA estimates place average compliance costs near 6 percent of export value, while a 2025 FEDS Notes article estimates additional USMCA automotive compliance costs of 1.4 to 2.5 percent ad valorem.
Economists at Banco de México show that a 20-percentage-point increase in rules of origin terms lowers U.S.–Canada intermediate exports to Mexico by 3.89 percent, while a 20-point most-favored nation tariff increase raises them by 3.18 percent by inducing compliance. Most-favored nation status suggests a similar motivation. When fallback tariffs were around 2.5 percent under most-favored nation status, many firms skipped certification, implying compliance costs were at least comparable to the tariff savings.
Preferences and fallback tariffs test USMCA’s value
The second scenario in Chart 3 depicts the impact of removing USMCA preferential treatment to encourage reshoring rather than regionalization. Mexico and Canada face tariffs on all goods sold to the U.S., but do not impose retaliatory tariffs, while other tariffs stay at January 2026 levels.
Considering tariffs alone, the effects are large and asymmetric. Consumption falls about 0.68 percent in Canada and 0.86 percent in Mexico, while the U.S. aggregate effect is small and slightly positive. The exercise likely understates the full cost because USMCA also governs border procedures, sourcing rules and trade facilitation, not just tariff preferences.
The third scenario raises tariffs only on non-USMCA-compliant goods. Mining, metals, computers and electronics face the higher of a 25 percent levy or the January 2026 tariff; other goods face the higher of a 5 percent levy or the January 2026 tariff.
Because noncompliant trade is only one-fifth of imports, effects are more limited. Consumption falls 0.39 percent in Canada and 0.37 percent in Mexico, while the U.S. effect remains close to zero, at 0.03 percent. Across the first three scenarios, the largest effects stay within North America. Outside spillovers are generally small because the policies mainly alter access to the U.S. market or the cost of non-USMCA sourcing in North American production.
Customs union is a benchmark, not a near-term template
A more ambitious route would move beyond USMCA toward a North American customs union. Unlike a free-trade area, which keeps separate national tariff schedules and relies on origin rules to promote greater regionalization, a customs union uses a common external tariff, allowing goods in free circulation to move internally with fewer origin checks. Proponents argue this could reduce rules of origin frictions, lower transaction costs and increase North America’s leverage with China and other partners.
The economics are not one-sided. Since Jacob Viner (a pioneering member of the Chicago school of economics), customs unions have been evaluated through trade creation and trade diversion. Integration raises welfare when lower internal barriers expand intra-bloc trade but can reduce welfare when preferences redirect trade away from more efficient external suppliers.
Krugman-style trade-bloc logic adds that larger blocs may possess more market power to improve terms of trade, though outcomes depend on design, the choice of common external tariffs and how outsiders respond. Gains would also be asymmetric: The U.S. already has substantial market power, so adding Canada and Mexico may matter more for their U.S. market access than for U.S. leverage abroad.
Benefits can arise from complementarity—U.S., capital and technology; Mexico, manufacturing and labor-intensive assembly; Canada, resources—or, when members are more similar, from scale, variety and competition. But higher external tariffs still risk trade diversion to less efficient bloc-suppliers at a cost.
Experience underscores both promise and limits. The World Trade Organization reports notification of 385 regional trade agreements in force as of June 2026. Customs unions are a much smaller subset. The European Union is the deepest case. The more relevant asymmetric EU–Turkey arrangement reduced some origin frictions, trimming trade costs by an estimated 2 percent and supporting Turkey’s integration into European value chains. It left tensions from partial coverage, asymmetric third-country agreements and weak dispute settlement.
North America would face similar complications. The USMCA already covers many non-tariff areas, but a full customs union would require coordination on external tariffs and third-country agreements, as well as tariff revenue sharing. It is therefore best viewed as a benchmark. A more practical step is targeted tariff coordination (especially vis-à-vis China) that preserves USMCA preferences and may lower pressure to tighten origin rules further.
Tariff coordination offers a softer path
The last two scenarios in Chart 3—targeted tariff coordination and coordinated tariffs—offer a softer path relative to the January 2026 baseline. In both, the U.S. restores Mexico and Canada to the January 2025 tariff schedule for non-USMCA goods sold into the U.S. Under targeted coordination, Canada and Mexico match U.S. January 2026 tariffs against China. Under coordinated tariffs, a so-called Fortress North America scenario, Canada and Mexico match the U.S. January 2026 external tariff schedule against all non-USMCA partners.
These scenarios borrow one customs-union feature, aligned external tariffs. But they don’t include its institutions: no common tariff-setting authority, customs administration or revenue sharing. The narrower goal is to reduce incentives for China or other non-USMCA suppliers to reach the U.S. market indirectly through Mexico or Canada while preserving North American trade preferences under USMCA.
The Santacreu-Sposi-Zhang model suggests these coordinated-tariff scenarios are less damaging than tighter rules of origin. Under targeted coordination, consumption falls about 0.20 percent in Canada and 0.11 percent in Mexico, while the U.S. effect is a 0.01 percent gain. Under broader coordination, consumption falls 0.22 percent in Canada and 0.10 percent in Mexico, and there is a gain of 0.04 percent in the U.S. China also loses modestly; spillovers to the rest of the world are small.
Tariff coordination works through prices and revenue rather than direct sourcing constraints. For Canada and Mexico, real factor income can still fall, but tariff revenue partly offsets those losses. That makes coordinated tariffs less costly in the model for all USMCA members than tighter rules of origin, which raise trade barriers without generating revenue.
State-level effects reveal what the U.S. aggregate hides
Chart 4 compares the distribution of consumption effects across the 50 U.S. states under tighter rules of origin and broad tariff coordination (a soft customs union), the two starkest regionalization tools. Under tighter rules of origin, outcomes are widely dispersed. State-level effects range from about –2.0 percent in New Jersey to +1.7 percent in Wyoming. Under Fortress North America, the distribution is more tightly concentrated near zero, ranging from about –0.05 percent in New York to +0.15 percent in Mississippi. Thus, even when the aggregate U.S. effects are similar, tighter rules of origin generate much greater geographic disruption, while tariff coordination produces smaller and more evenly distributed adjustments.
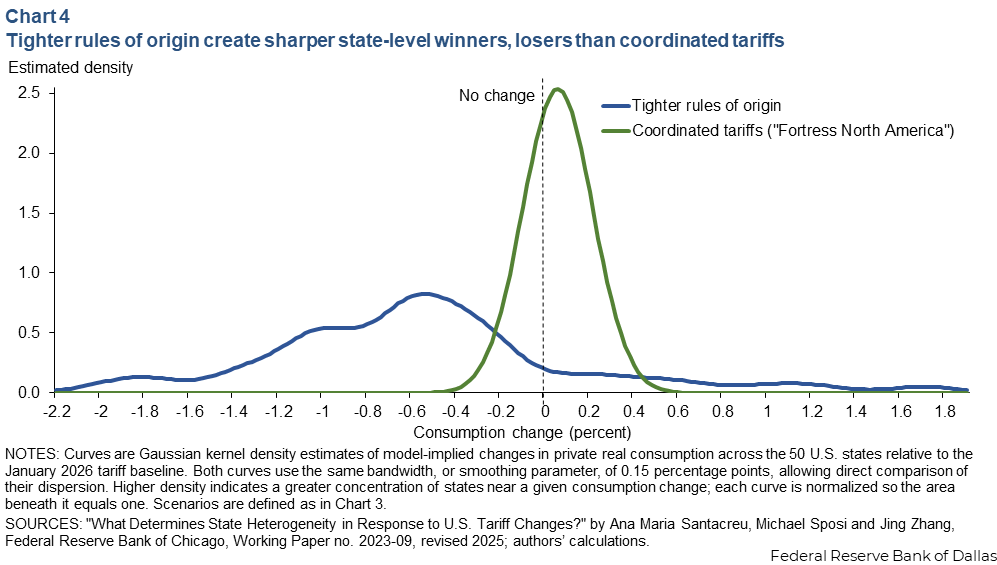
Political economy is shaped by local effects, not just national averages. States whose industries face strong foreign competition may benefit from protection or regional sourcing requirements; states reliant on imported inputs or integrated supply chains—New York/New Jersey, for instance—may lose. A policy close to neutral for the U.S. overall can still create domestic regional tensions if gains and losses are concentrated.
Industry effects explain the state-level variation
Tighter rules of origin generate large industry swings. Textiles rise nearly 5 percent and nonmetallic minerals, wood, metals and agriculture also gain. Meanwhile, refined products fall about 3.3 percent, transportation equipment 2.8 percent and chemicals 2.0 percent. Because states differ in industry composition, these sectoral shocks translate into varied state outcomes (Chart 5).
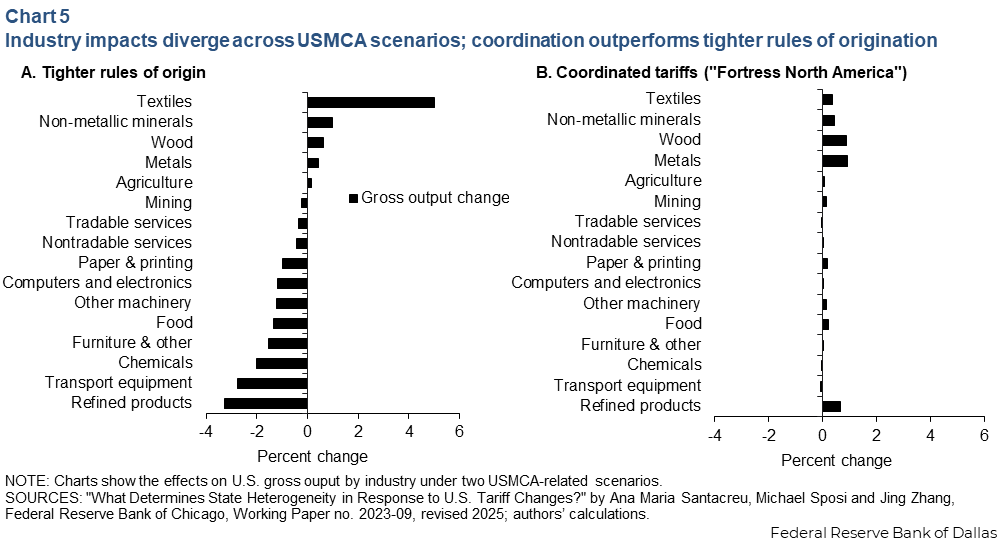
Coordinated tariffs produce broader but more muted industry effects. Under Fortress North America, metals and wood rise less than 1 percent, while the largest losses are modest, about 0.08 percent in transportation equipment and 0.04 percent in chemicals. Similar aggregate effects can therefore imply very different sectoral and regional adjustments.
How regionalization unfolds matters
The ongoing USMCA renewal process comes as the U.S. rethinks its supply-chain exposures and the structure of North American trade. If the aim is shorter, more resilient regional supply chains, the policy instrument matters.Regionalization can be pursued through stricter conditionality, higher fallback tariffs or coordinated external tariffs. Tighter rules of origin impose sourcing and compliance costs without revenue. Removing preferences would severely hurt Canada and Mexico. Higher tariffs on noncompliant goods have limited effects because much trade adheres to the USMCA.
By contrast, tariff coordination appears more promising. It changes incentives through prices, generates revenue, cushions some losses and produces similar aggregate effects for the U.S. with less dispersion across states and industries.
Deeper North American integration could reduce rules of origin frictions while limiting transshipment and offshoring (particularly involving China), but it would require coordination on common external tariffs, revenue sharing and third-country agreements.
If the objective is deeper regional production networks with the fewest frictions, policy design is as important as policy direction. USMCA is therefore not only a question of U.S. diplomacy or market access for Canada and Mexico; it hinges also on the distribution of adjustment and industrial geography within the U.S.
Appendix: Model intuition in plain language
A tariff creates a gap between the price paid by importers and the price received by exporters. If the importing country is small, foreign prices are usually fixed and the domestic price rises mechanically. If the importer is large like the U.S., foreign exporters may lower pre-tariff prices to preserve market access, shifting part of the burden abroad via the terms-of-trade channel. Tariffs still impose domestic costs. They increase the cost of imported goods and inputs, change production and consumption decisions, and can reduce real factor income. But tariffs also generate government revenue. In the Santacreu-Sposi-Zhang framework, that revenue is rebated to households, so the household accounting is: PnCn = Fn + Tn, Tn = Rn Total consumption spending (PnCn) equals factor income (Fn) plus government transfers (Tn). Transfers equal tariff revenue (Rn). Real factor income can fall while consumption falls by less (or even rises) if terms-of-trade gains and tariff revenue offset enough of the loss. The outcome depends on pass-through, revenue raised and production and consumption distortions. Production networks complicate the picture. A tariff on a final good may protect domestic producers, but tariffs on imported parts, materials or equipment raise costs. An appliance producer may gain from tariffs on imported appliances but lose if tariffs raise the cost of motors, steel or electronics. This is effective protection. What matters is not just the final product tariff, but its net effect on domestic value added after input costs. Sectors gain when output prices rise more than input costs. Similarly, they lose when imported inputs become too expensive. That is why a sector- and state-level model like that of Santacreu-Sposi-Zhang is needed. |
|
This article is part of a series examining China’s evolving trade and investment linkages with North America and the subsequent policy responses. The series looks at Chinese foreign direct investment in Mexico, the impacts of U.S. limits on Chinese imports and the prospects for nearshoring of North American supply chains. |
About the authors

Enrique Martínez García is an assistant vice president in the Research Department and co-director of the Global Institute at the Federal Reserve Bank of Dallas.

Michael Sposi is an associate professor of economics and director of doctoral studies at Southern Methodist University.

Brendan Kelly is a former visiting fellow at the Federal Reserve Bank of Dallas Global Institute.