Mexico seeks to solidify rank as top U.S. trade partner, push further past China
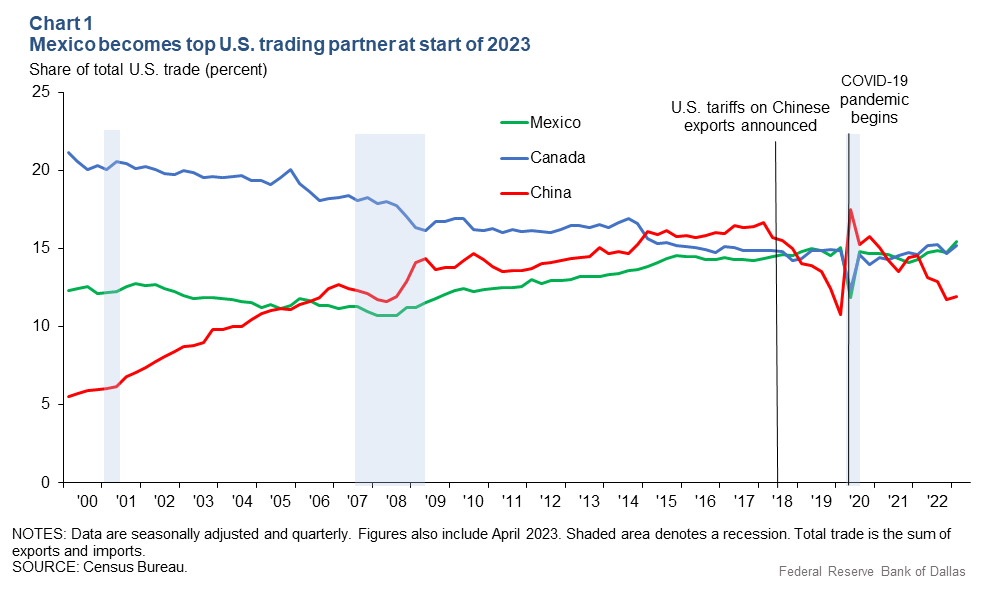
Mexico became the top U.S. trading partner at the beginning of 2023, with total bilateral trade between the two countries totaling $263 billion during the first four months of this year.
Mexico's emergence followed fractious U.S. relations with China, which had moved past Canada to claim the top trading spot in 2014. The dynamic changed in 2018 when the U.S. imposed tariffs on China’s goods and with subsequent pandemic-era supply-chain disruptions that altered international trade and investment flows worldwide.
Mexico’s gains mirror its rise in manufacturing, a key component of goods moving between it and the U.S. During the first four months of 2023, total trade of manufactured goods between Mexico and the U.S. reached $234.2 billion.
Overall, Mexican imports to the U.S. totaled $157 billion; U.S. exports to Mexico reached $107 billion.
Mexico–U.S. trade during the first four months of 2023 represented 15.4 percent of all the goods exported and imported by the U.S.; the Canada–U.S. share followed at 15.2 percent and then the China–U.S. share at 12.0 percent (Chart 1).

China gains follow World Trade Organization membership
China’s share of U.S trade had steadily increased since it joined the World Trade Organization (WTO) in 2001. WTO member nations enjoy preferential tariffs when trading with one another and are protected from nontariff barriers such as quotas and currency restrictions—an incentive for foreign direct investment. They also participate in the development of new international trade rules.
Once in the WTO, China’s access to the world’s premier consumer markets, combined with its own economic prowess and ability to marshal resources for growth, quickly transformed the country into a leading manufacturing hub.
Within a decade of its admission, critics increasingly accused China of flooding the world with cheap exports while limiting foreign access to its market. China’s trade growth coincided with sharp declines in U.S. manufacturing employment. Sectors and regions especially exposed to China’s trade tended to experience higher unemployment, lower labor force participation and reduced wage growth.
U.S. imposes tariffs of China’s exports
U.S.–China trade began trending lower in 2018 after the Trump administration imposed new tariffs on imports from China, whose government responded with a similar action on imports from the U.S. China subsequently lost its position as top trading partner later that year.
Approximately $335 billion in trade (66.4 percent of China’s exports to the U.S.) remains subject to the tariffs. The average U.S. tariff on Chinese imports is 19.3 percent, while China’s average tariff on U.S. imports is 21.2 percent, according to the WTO. This exceeded tariffs among WTO members (enjoying most-favored-nation status) of 9 percent.
There was a short-lived rebound in China’s trade share during the pandemic that subsequently gave way following supply-chain disruptions, many involving shipping and manufacturing originating in China.
Mexico and Canada, which are highly interconnected to the U.S. economy, vied for the top spot. The three economies were formally tied together with the 1994 North American Free Trade Agreement (NAFTA) and again in 2020 with the United States–Mexico–Canada Agreement that replaced NAFTA.Mexico positioned as a manufacturing base
Mexico’s expanding manufacturing base has offered an alternative to producing in China. Sourcing or producing goods in a nearby country is sometimes referred to as “nearshoring.” While data on recent nearshoring is thin and evidence of it is largely anecdotal, increased protectionism and related industrial policy are consistent with less global trade, more regional trade, and nearshoring and reshoring (returning production to the home country).
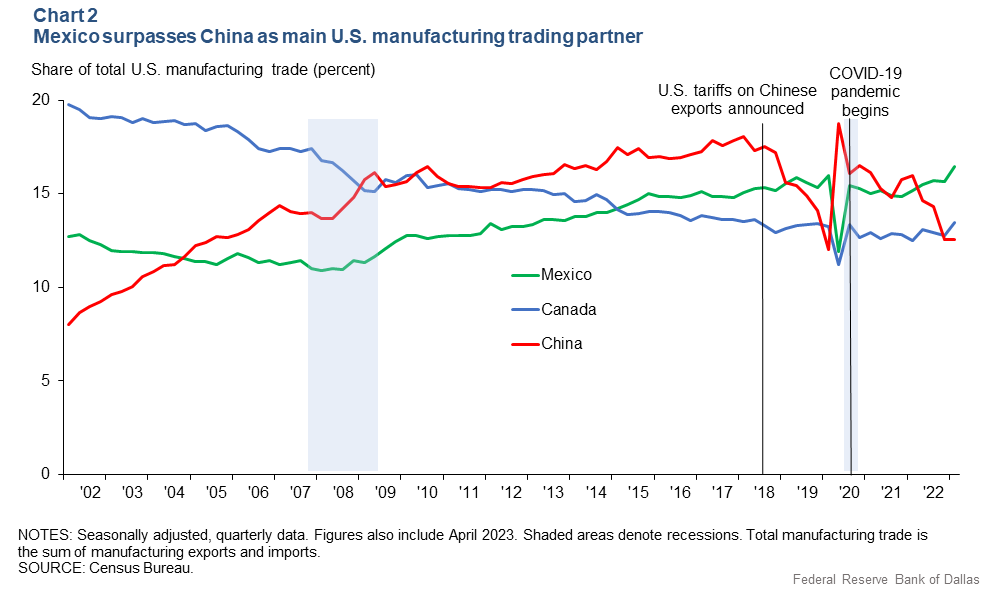
More activity in Mexico would support increased bilateral manufacturing with the U.S. It would also bolster Mexico’s standing as the U.S.’ leading manufacturing trading partner, a ranking it achieved in 2022 (Chart 2).

Bilateral manufacturing trade between Mexico and the U.S. represented 16.5 percent of all U.S. manufacturing trade; the Canada–U.S. share followed at 13.5 percent and then the China–U.S. share at 12.5 percent.
Automotive industry plays key role
The automotive industry is an especially active example of the cross-border manufacturing relationship. A U.S. plant typically produces an intermediate good that is then exported to Mexico where it becomes part of the assembly process before a final good is then imported back into the U.S.
The supply trade linkages are supported by the presence in Mexico of foreign-owned, labor-intensive assembly plants for export—the so-called “maquiladoras” Over the past 20 years, transportation has accounted for about 24.5 percent of total bilateral manufacturing trade, followed by computer and electronic equipment, 22.4 percent; electrical equipment, appliances and components, 8.5 percent; and machinery (excluding electrical), 7.7 percent.
While Mexico benefits from increased trade with the U.S., the impact on U.S. producers and consumers has been mixed. To the extent that frictions with China account for Mexico’s ascension in the trade rankings, the higher profile comes at a cost to U.S. firms and consumers through higher input and purchase prices.
While the principal focus of trade policy was once free trade, greater efficiency and lower prices, that may no longer be the case. Today’s global economic relationships encompass a myriad of concerns, among them national security, climate policy and supply-chain resiliency.
About the author
The views expressed are those of the author and should not be attributed to the Federal Reserve Bank of Dallas or the Federal Reserve System.


