China manufacturing overcapacity boosts output, stagnation fears
China’s economy has experienced rapidly growing indebtedness and fixed asset investment since the 2008 Global Financial Crisis.
Overinvestment initially showed up in a booming real estate sector, but more recently has taken hold in the industrial sector. Ultimately, it has produced overcapacity and the current phenomenon of involution—disorderly price competition that damages industry health—with producer price deflation and increasing losses among domestic firms.
Such overcapacity is made possible in part by the phenomenon of zombie lending, characterized by banks unwilling to realize losses and instead rolling over the debt of unprofitable firms. This inefficient allocation of capital is enabling unprofitable firms to survive, forcing the government to engage in an anti-involution campaign to curb the resulting overcapacity.
Boom begins with real estate
Real estate investment was one of the fastest growing components of investment through much of the recent period leading to the pandemic (Chart 1). Between the 2008 crisis and the pandemic, real estate investment fell below industrial investment only twice and for short periods (in 2012 and 2015).
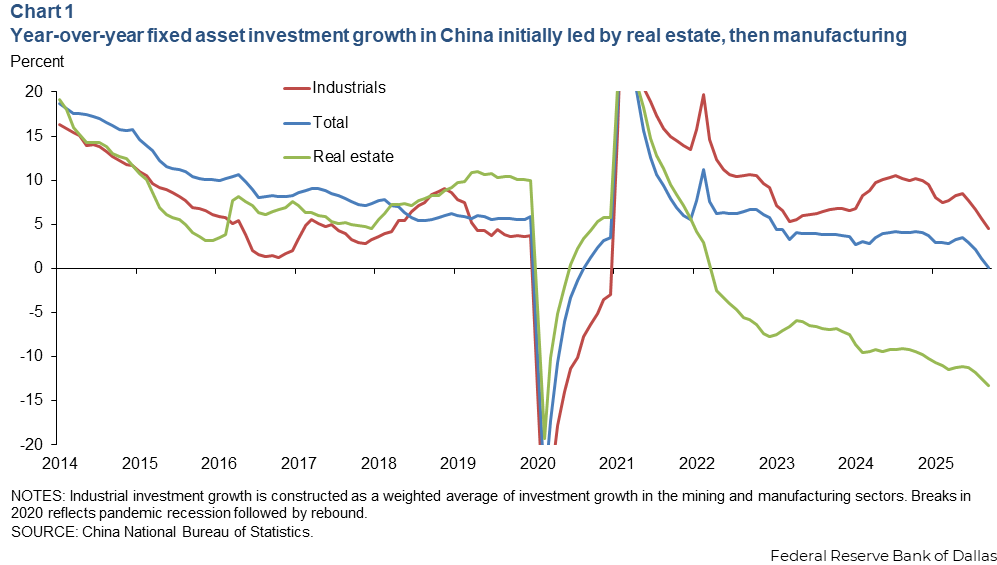
The real estate sector peaked in 2021. Then, real estate investment contracted in early 2022 and is since little changed. The decline was offset by a spike in investment in China’s industrial sector that was sustained through 2022. This kept total fixed asset investment stable even as the real estate sector was a drag on overall investment.
While this surge in industrial investment stabilized total investment in the Chinese economy during 2021–22, it has led to overcapacity in the industrial sector. This overcapacity can be defined as a level of supply that cannot be absorbed by demand at current prices.
Overcapacity in industrials ranges among sectors
To track how the surge in industrial investment in 2021 and 2022 led to the current overcapacity in the Chinese industrial sector, it is useful to note that not all sectors participated equally in the investment boom earlier in this decade. Industrial asset growth totaled 22 percent over the 2021–22 period, but across 39 industrial sectors asset activity ranged from a 4 percent contraction to 70 percent growth.
These 39 industrial sectors can be divided into two groups. The 19 with above median asset growth over the 2021–22 period and the 20 with below median asset growth. On average, for the industrial sectors with above median asset growth, assets increased 32 percent, whereas industry assets grew 12 percent in the low-growth sectors. The high-growth asset sectors overlap significantly with sectors prioritized in the Made in China 2025 initiative, which stressed advanced manufacturing and technological self-sufficiency.
Surge in capacity leads to producer price deflation
The most obvious effect of the industrial capacity surge has been producer price deflation. Headline, year-over-year producer price inflation in China is -2.3 percent and has been below zero for 38 straight months (Chart 2).
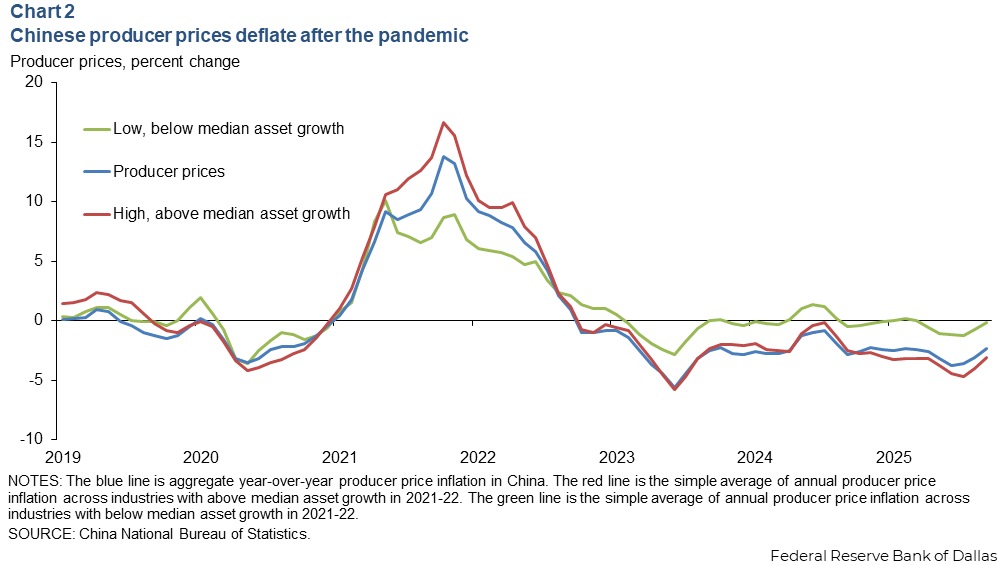
We can observe producer price inflation in each of the 39 industrial sectors. Producer price inflation in high-growth asset sectors is well below the national headline figure, at around -4 percent. Meanwhile producer price inflation for the group of low-growth sectors has been near zero since 2023.
Overcapacity and falling prices are leading to declining firm profits. Chinese industrial profits have fallen most months since late 2022, rebounding only modestly recently.
Many Chinese industrial firms are losing money (Chart 3). For all industrial firms, this share was around 20 percent before the pandemic, spiked during the pandemic and returned to prepandemic levels by early 2021. The share has risen again since early 2022; nearly 30 percent of all industrials in China operate at a loss currently.
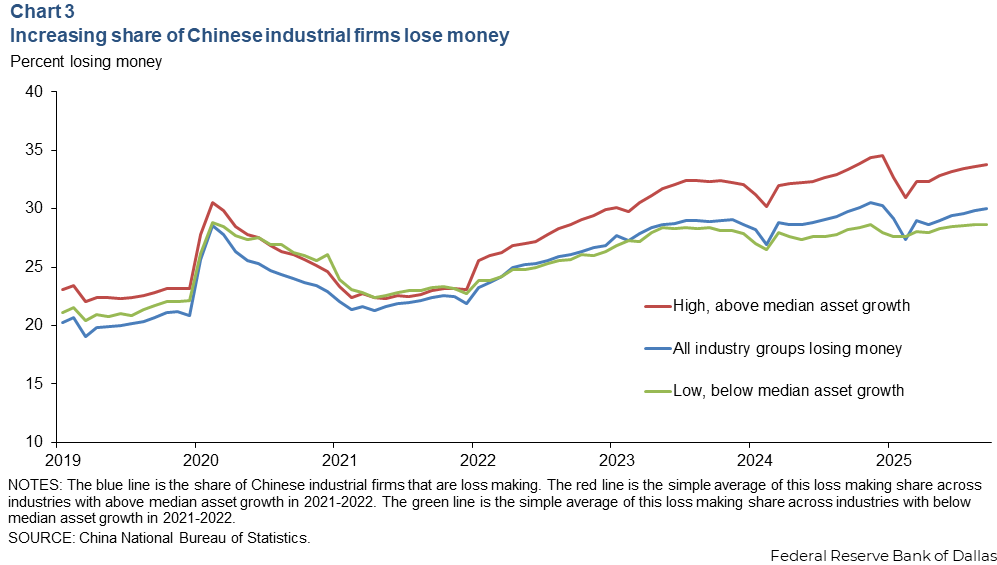
In early 2022, the loss-making share among high- and low-growth asset groups was about the same. Since then, the loss-making share has grown more quickly in the high-growth asset sectors, reaching 34 percent in August 2025, compared with 28 percent in the low-growth asset sectors.
‘Here we must run as fast as we can, just to stay in place’
In Lewis Carroll’s Through the Looking Glass, the Red Queen offers this assessment of the difficulty of maintaining the status quo. The quotation also summarizes the situation of firms in overcapacity sectors. With surging capacity, falling prices and nearly a third of firms operating at a loss, such entities are incentivized to produce as much as possible, just to stay afloat.
Even though the economy has experienced significant producer price deflation during the past three years, the growth rate in real (inflation-adjusted) industrial value added increased over the period to 6.5 percent (Chart 4).
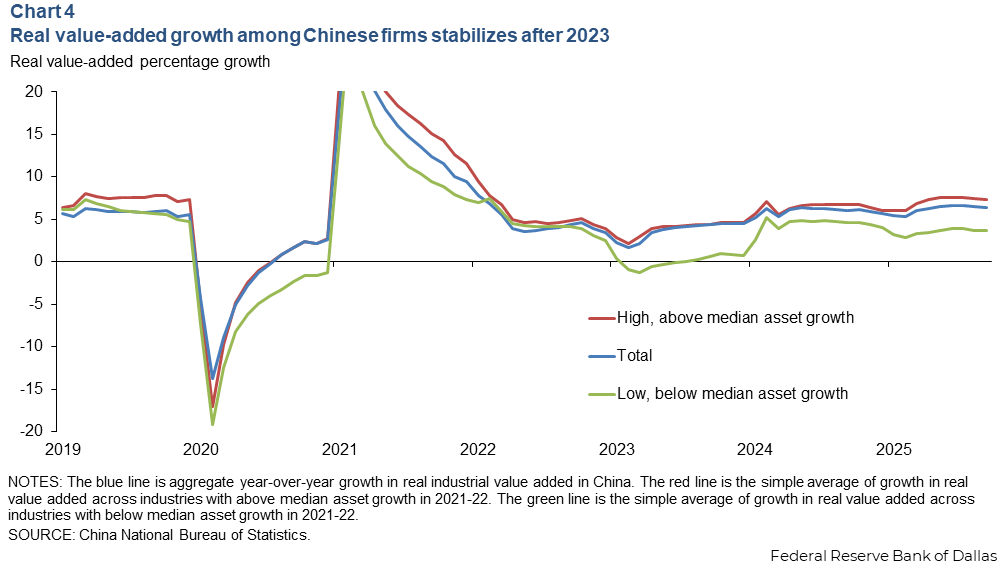
With weak domestic demand, this situation is contributing to surging exports and growing pushback from China’s trading partners.
We can observe this growth in real value added at the sector level for our 39 industrial sectors. For those that experienced high growth during the postpandemic period, industrial value added is increasing around 7.5 percent annually, above the national average. This is despite greater price deflation for these sectors and a higher proportion of firms incurring losses, factors that typically could lead to rationalization of production. Meanwhile, low-growth sectors have experienced a more subdued increase in value added of around 3.5 percent.
Overcapacity common among Made in China 2025 sectors
The government launched its Made in China 2025 initiative in 2015. It prioritized growth in 10 mostly high-tech industries: advanced IT, robotics, aerospace, maritime, railroads, energy, biotechnology, agricultural equipment, new materials and new energy vehicles.
These Made in China 2025 sectors can be linked with 12 of the 39 industrial sectors considered in this analysis. Ten of these 12 sectors are among those with above median asset growth during the 2021–22 period.
The average producer price inflation rate in 2024–25 in all 39 sectors is -1.4 percent. The average producer price inflation across these 12 Made in China 2025 sectors is -2.2 percent. The average real value-added growth over 2024–25 across the 39 sectors is 5.4 percent; across the12 Made in China 2025 sectors, it is 6.9 percent. The shares of loss-making firms in a number of these Made in China sectors are well above the national average.
These results highlight the broad-based deflation and overcapacity issues across sectors. More traditional industrial sectors, such as chemicals and nonmetal mineral products, graphite, glass and ceramics, experienced some of the greatest producer price index deflation.
Yet, sectors such as electrical machinery and equipment (29 percent of firms were losing money in 2024–25), communications equipment and computers (34 percent losing money), and medical and pharmaceutical products (32 percent losing money) have received less attention in discussions of China’s overcapacity. They, too, have experienced sustained deflation and increases in loss-making firms.
Government seeks to curb this overcapacity
The Chinese launched an anti-involution campaign to address those issues. Through increased regulatory oversight, corporate restructuring and industry-specific price controls, the government is trying to curb overproduction and falling prices in sectors such as autos, solar, batteries, and ferrous and nonferrous metals.
The government engaged in a similar campaign a decade ago to curb the overcapacity that led to a prolonged period of producer price deflation, lasting 54 months. The campaign, called Supply Side Structural Reform, targeted old economy industries such as steel, aluminum and coal. The substantial drop in industrial investment in 2016 was part of this structural reform. A simultaneous pickup in real estate investment smoothed the effects on aggregate investment in the macroeconomy.
Industrial investment in China is down from a peak in 2024. But four years after the property bubble burst, real estate investment is contracting at a 12 percent annual rate, and the sector cannot pick up the slack once again from efforts to curb industrial overcapacity.
What sustains this high share of loss-making firms?
Nearly 30 percent of industrial firms operate at a loss, up from 20 percent before the pandemic. The question arises: How can this be sustained? These loss-making firms tend to be relatively small, yet in a separate analysis we find a growing proportion of the manufacturing sector operating at a loss, amounting to nearly 11 percent of assets in the sector, up from just over 4 percent in 2019. Who is financing these loss-making firms?
In a previous article we discuss the rise of zombie lending in China. This type of financing was common during Japan’s post-bubble experience in the 1990s and contributed to economic stagnation. It’s uncertain whether China will repeat that outcome.
About the authors

Scott Davis is an assistant vice president in the Research Department of the Federal Reserve Bank of Dallas.

Brendan Kelly is a former visiting fellow at the Federal Reserve Bank of Dallas Global Institute.