Mexican residents favor local retailers over cross-border shopping in Texas
Mexican shoppers have traditionally represented a considerable share of Texas border cities’ retail sales, as high as 40-45 percent in Laredo, for example. But over the past 20 years, that contribution has declined as northern Mexico’s economy grew and residents experienced income growth.
Competition from Mexico’s expanding big-box retail sector is providing locals more shopping choices closer to home. Moreover, increased security and longer wait times at U.S. ports of entry may also deter would-be shopping trips to border retailers in the U.S.
U.S., Mexico boast strong economic ties
The U.S. and Mexico have become increasingly economically interconnected over the past several decades, particularly after implementation of the North American Free Trade Agreement in 1994 and its successor, the United States-Mexico-Canada Agreement, increased cross-border manufacturing activity.
Ties further strengthened as trade tensions escalated between the U.S. and China starting in 2018. The economic ties were further bolstered by the pandemic, when supply chain disruptions jump-started nearshoring efforts to bring production closer to North America. Mexico became the top U.S. trading partner in 2023, with trade between the two totaling $839.6 billion in 2024.
Moreover, ties between the U.S. and Mexico extend beyond traditional commercial ones, particularly along the border where communities share deep cultural and economic bonds. The Texas-Mexico border, which constitutes 64 percent of the U.S.–Mexico international boundary, includes four major binational urban centers.
These paired cities stretch from El Paso–Ciudad Juárez in the west to Brownsville–Matamoros in the east, with Laredo–Nuevo Laredo and McAllen–Reynosa between them. Daily life in these interconnected metropolitan areas transcends national boundaries, as individuals and families routinely cross the border for shopping, employment, education, health care and visits with family and friends.
In these border pairs, except for McAllen–Reynosa, the Mexican cities are larger than their U.S. counterparts in population and employment (Table 1). The El Paso–Juárez metropolitan area stands as the largest border city pair in Texas, boasting a combined population of 2.4 million residents and supporting approximately 1.1 million jobs.
| City | Population | Employment |
| El Paso | 879,392 | 355,290 |
| Ciudad Juarez, Chihuahua | 1,577,417 | 783,374 |
| Laredo | 272,823 | 114,052 |
| Nuevo Laredo, Tamaulipas | 438,824 | 210,567 |
| McAllen | 914,820 | 306,806 |
| Reynosa, Tamaulipas | 702,956 | 317,268 |
| Brownsville | 431,874 | 164,762 |
| Matamoros, Tamaulipas | 559,532 | 268,488 |
| NOTES: Population figures for Ciudad Juarez and Reynosa are for 2025. The populations for Matamoros and Nuevo Laredo were estimated by authors for 2025. Texas metro populations are for 2024. Employment data for Texas and Mexican border cities are for August 2025. SOURCES: Census Bureau; Bureau of Labor Statistics; Texas Workforce Commission; National Institute of Statistics and Geography (INEGI); seasonal and other adjustments to Texas employment data by the Federal Reserve Bank of Dallas. |
||
While Texas border cities have enjoyed strong employment growth—in some cases even outperforming the state economy’s rapid growth rate—income levels have progressed little.
Meanwhile, cities along Mexico’s side of the border experienced high economic growth accompanied by rising income levels through the 2000s and 2010s in part due to the robust maquiladora industry though employment in the sector has declined since mid-2023. The average per capita income along Mexico’s northern border is about 120 percent of Mexico’s national average. By comparison, the population-weighted average per capita income of the four major Texas border cities represents just 60 percent of the U.S. national average.
Although the magnitude of cross-border retail trade is small relative to international trade flows, it has been a significant part of many border cities’ local economies. Mexico's northern border cities create opportunity for significant spillover effects and further economic integration. However, with the increased wealth, large retailers have moved into the Mexican communities seeking to capture the growing market.
How to calculate exported retail sales in Texas border cities
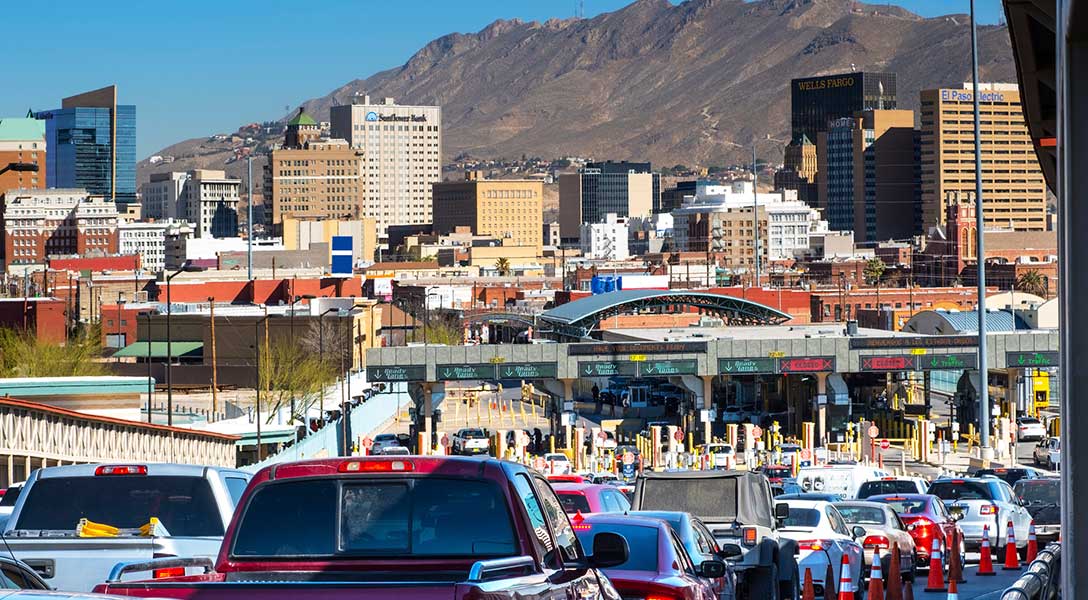
On an average day, approximately 230,000 people cross into the U.S. at the bridges along the Texas-Mexico border on foot or in personal vehicles. Many are Mexican citizens coming into the U.S. who historically have sought U.S. shopping for affordable high-end clothing and footwear as well as for products unavailable in Mexico.
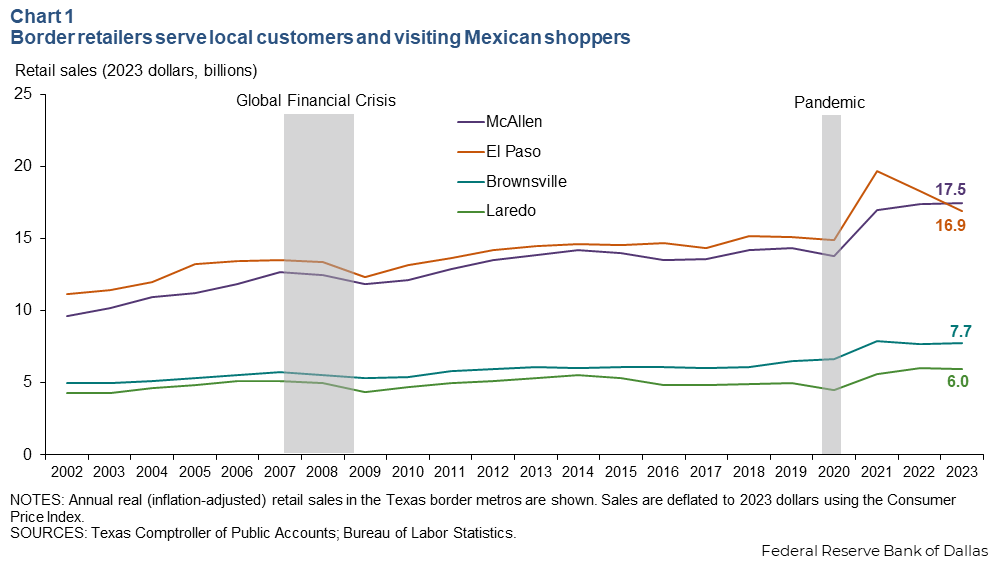
The Texas retail market along the border is large (Chart 1). McAllen retail sales totaled $17.5 billion in 2023, while in El Paso, they reached $16.9 billion. In smaller Brownsville, retail sales were $7.7 billion and in Laredo $6.0 billion. Together, retail sales in the border metros totaled $48.1 billion in 2023, growing at an average annualized rate of 2.2 percent in real (inflation-adjusted) terms from 2002 through 2023.
Mexican cross-border shoppers often use cash, making it difficult to calculate their share of local retail spending. To estimate their share of U.S. border metro retail sales, we use an indirect approach building on previous work at the Federal Reserve Bank of Dallas.
The methodology estimates border metro retail sales based on local measures of population, employment and personal income. Excess sales, those that cannot be attributed to the local population based on these variables, are assumed to be exported retail sales attributable to Mexican shoppers.
The border has historically had unique economic characteristics, such as high job growth rates but low employment-to-population ratios, high unemployment rates and low per capita personal income.
Controlling for these factors in the analysis is important, since they play important roles in determining retail spending. Notably, while those economic characteristics of border cities persist, unemployment and poverty have improved greatly relative to the rest of the state.
To match previous estimations, we estimate a model for the typical consumption behavior of Texans, drawing on data for the 23 non-border Texas metropolitan statistical areas (MSAs) from 2002 through 2023.
Specifically, we regress metro-level real per capita personal income, the employment-population ratio and employment on metro-level real retail sales for the 23 MSAs. We then estimate what local retail sales should be for the four border cities each year. Finally, we take actual total retail sales in each of the border cities and subtract the estimated sales to calculate likely net exported retail sales.
If the value of net exported retail sales is negative, more local income is spent outside the local economy (in Ciudad Juarez, for example,) than income spent by outsiders in the local community (in this example, El Paso).
Mexican shopping declines slightly over time
Exported retail sales have evolved over the past two decades, revealing the complex relationship between Mexican consumers and U.S. border economies (Chart 2). Laredo provides the strongest evidence for the declining importance of Mexican shoppers. Exported retail sales there fell from over 20 percent of local retail sales in 2002 to zero by 2017 before rebounding to approximately 15 percent by 2023 following postpandemic spending surges.
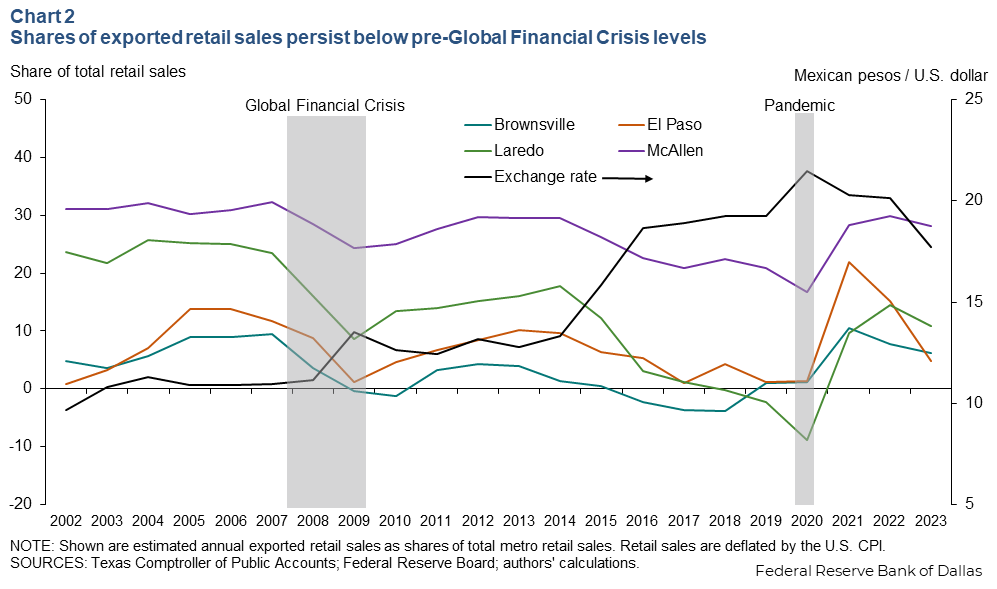
The decline in exported retail sales during the Global Financial Crisis is also notable. Mexico's economy contracted 6 percent, and despite the prolonged recovery period, exported retail sales never returned to peak precrisis levels.
Exchange rate dynamics also play a critical role in shaping exported retail sales patterns because they represent potential price shocks for Mexicans shoppers on the U.S. side. Sharp declines in the peso’s value require more pesos per dollar, meaning Mexicans pay higher prices for U.S. goods.
After a period of relative exchange rate stability between 2010 and 2014, when the peso-dollar exchange rate held around 10 pesos per dollar, retail sales to Mexican residents generally trended higher. However, sales fell sharply when the exchange rate rose to 18 pesos per dollar at the beginning of 2015. (Elections and political uncertainty on both sides of the border contributed to the exchange-rate move.)
More recently, when international bridges reopened following pandemic closures, sales to Mexican citizens trended lower after an initial spike higher in 2021. The temporary retail surge during the early pandemic period likely reflected consumption patterns attributable to fiscal stimulus payments on the U.S. side of the border and lockdown measures that shifted spending from services toward retail goods. The period also included a migration wave that likely boosted border retail spending.
Earlier estimates also indicate falling exported retail sales
Exported retail sales have fallen significantly on average over the last 20 years, based on historic Dallas Fed estimates (Table 2).
| Average share (percent) | ||
| 1978–2001 | 2002–23 | |
| McAllen | 35.6 | 27.2 |
| Laredo | 51.1 | 13.0 |
| El Paso | 11.3 | 7.4 |
| Brownsville | 25.7 | 3.3 |
| SOURCE: Authors' calculations for the 2002–23 period. For 1978–2001 estimates see “The Face of Texas: Jobs, People, Business, Change,” by Keith R. Phillips and Roberto Coronado, Federal Reserve Bank of Dallas Research Department, October 2005, pp. 24–26 | ||
In 2023, McAllen was the biggest net exporter of retail sales to Mexican citizens by both volume and share of sales, with almost $4.9 billion in sales, representing 28.2 percent of its total local retail trade activity. This is most likely due to McAllen’s proximity to Monterrey, Mexico’s second largest city by population and also its second richest.
In terms of volume, El Paso was second in 2023 with $803 million in exported retail sales, or 4.8 percent of total retail sales. Laredo exported $644 million (10.8 percent of total retail sales), while Brownsville exported only $480 million (6.2 percent).
Fewer visits, better Mexican options depress cross-border sales
Historically, Mexico’s business cycle and exchange rate fluctuations largely drove exported retail sales variations. However, the overall lower share of exported retail sales suggests a change over the past 20 years.
Tighter border security, resulting in long lines at ports of entry into the U.S., has reduced the number of border crossers and is likely one reason behind the exported retail share drop.
Northbound passenger vehicles and pedestrian crossings have been declining since 9/11, when security tightened considerably at the ports of entry, increasing crossing times (Chart 3).
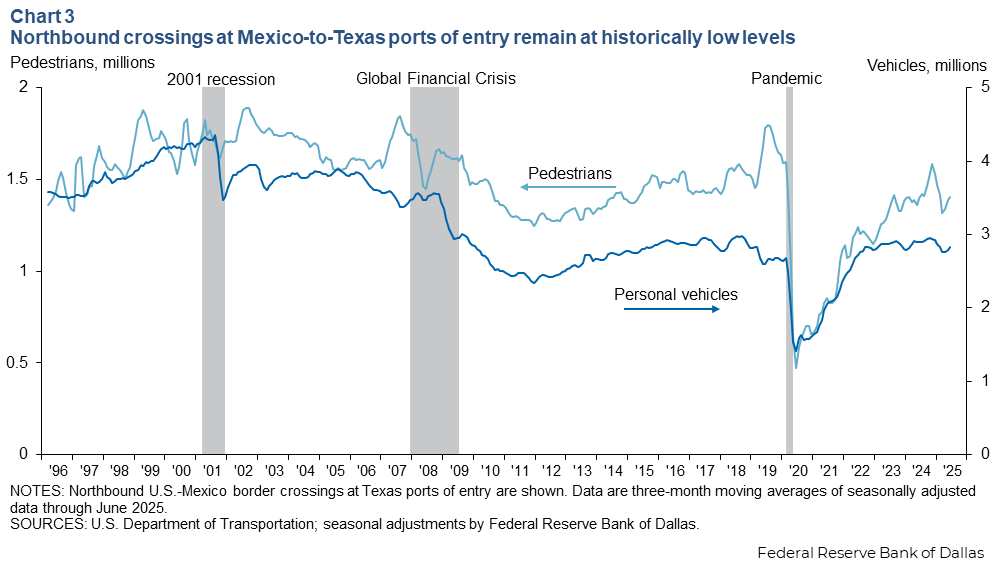
Vehicle and pedestrian crossings fell during the pandemic following a period of relative stability. Pedestrian crossings, while gradually recovering, remain below prepandemic levels. Passenger vehicle crossings finally reached prepandemic levels in 2024. Both, however, remain well below pre-9/11 levels.
A recent cross-border survey from the city of El Paso International Bridges Department indicates that Ciudad Juarez shoppers now care more about wait times than about the exchange rate when deciding whether to shop in El Paso. Only 5 percent of Ciudad Juarez crossers responded that the exchange rate—holding at about 18 pesos to the dollar—helped determine their spending decisions, while 53 percent said wait times influenced their crossing decisions. This could help explain why exported retail sales have been less sensitive to changes in the peso-dollar exchange rate in recent years, a period lacking wide currency swings.
A wider range of product choices on the Mexican side of the border over the past two decades could be another factor. American big-box and warehouse stores added locations in Mexico, providing consumers access to greater variety and discounted merchandise without traveling into the U.S.
In 1998, Walmart reported 204 stores in Mexico. By 2024, the company’s presence had surged to 3,154 locations through both expansion and acquisition. Other retailers, such as Costco and Amazon, have also expanded in Mexico, albeit at a slower pace. Costco operated 16 stores in Mexico in 1998, growing to 41 by 2024. Amazon opened a fulfillment center in Tijuana and a second one in Monterrey in 2021. Both companies have announced plans for further expansion in Mexico.
Cross-border shopping is often driven by a lack of product availability, better deals or access to special items not found at home. Greater product selection in a domestic market typically slows cross-border shopping.
Mexican retail outlook challenges cross-border sales
Texas retailers may still have an edge because they generally still carry a greater variety of items, have the latest styles and often sell at lower prices than in Mexico. Wages in Mexico are also rising, aiding consumption. The federal government there has increased the minimum wage about 135 percent in real terms since December 2018, with further wage increases planned in 2026. Meanwhile, peso appreciation in recent years has also benefitted Mexican consumers.
While these factors should contribute to the long history of net positive exported retail sales along the Texas-Mexico border, Mexico’s retail industry is undergoing a major transformation. The number of high-end and warehouse stores in large and medium Mexican cities is eroding some of the advantages retailers still offer in the U.S.
Longer crossing lines, plus increased presence of U.S. agents in parking lots of border department stores as well as immigration raids pose an unwelcoming reality that may further deter Mexican shoppers.
About the authors

Isabel Brizuela is a business economist in the Research Department of the Federal Reserve Bank of Dallas.

Jesus Cañas is a senior business economist in the Research Department of the Federal Reserve Bank of Dallas.

Robert Leigh is a research analyst in the Research Department at the Federal Reserve Bank of Dallas.