
New data show intensifying unauthorized immigration decline, with large local variations
U.S. net unauthorized immigration has rapidly declined, turning negative in February 2025. The contraction follows a rapid increase from early 2021 to early 2024. This sudden reversal has important implications for the demographic outlook, labor force participation, employment growth and local labor markets.
A key lesson from recent studies is the need for reliable estimates of unauthorized immigration, the main driver of the postpandemic immigration cycle. This need has become more pressing since 2025 because data on removals and other emigration remain limited.
As a result, analysts often rely on annual projections to gauge the state of net immigration. Moreover, little is known about the geographic variation involving unauthorized immigrant entry and exit across the U.S.
We draw on newly available, individual-level data from immigration court proceedings and parole cases, along with other aggregate information, to track recent trends in unauthorized immigration at both the national and local levels. In a follow-up study, we will examine how these swings affect employment growth, using evidence from local labor markets.
Our analysis leads to two key findings. First, it shows that net unauthorized immigration has been increasingly negative since early 2025 (Chart 1). By July, it reached -89,000 with no indication the decline is levelling off. Focusing on working-age (16–65) adults and adjusting for historical employment rates implies a net loss of about 49,000 unauthorized immigrant workers in July alone.

Second, we find that areas that experienced the largest inflows from 2021 to 2024 are experiencing the sharpest outflows, pointing to potential further softening of those labor markets.
New data shed light on entries, exits
“Unauthorized” immigrants in this context refers to individuals who entered the U.S. without formal admission into the country under immigration law. Federal agents encounter the vast majority either at ports of entry, along the border or in the interior. Most of these immigrants then receive a “Notice To Appear” in immigration court to seek asylum or otherwise challenge their removal. Historically, most immigrants have been permitted to remain in the U.S. while their cases proceed in the courts. A court case typically requires at least a year and often several years for resolution.
To estimate unauthorized immigration entries and exits, and hence net immigration, we use a bottom-up approach similar to the Congressional Budget Office (CBO), Duzhak and New-Schmidt (Federal Reserve Bank of San Francisco, 2025), Edelberg et al. (American Enterprise Institute, 2025) and Orrenius et al. (Federal Reserve Bank of Dallas, 2025).
These studies provide estimates through 2024 and offer annual projections beyond that. Our approach differs in one key dimension: We use the underlying microdata for major immigration categories. This allows us to produce monthly estimates of entry and exit of unauthorized immigrants in terms of total population, working-age adults and workers through July 2025, nationally and locally.
To measure the inflows and outflows of people who entered with notices to appear—the largest category of unauthorized immigration—we use individual-level data on immigration court filings obtained through Freedom of Information Act requests by the Transactional Records Access Clearinghouse at Syracuse University. These data contain nationality, age, U.S. residence location, and dates of entry and exit (when available) for people in court proceedings.
We also use individual-level data from the Customs and Border Protection’s Office of Field Operations for paroles issued at ports of entry and from the Border Patrol for paroles issued between ports of entry. These data do not identify location of residence but provide information on age and country of origin that we use to identify working-age adults and to estimate exits based on country-specific parole durations. We supplement these individual-level data with Department of Homeland Security estimates of so-called got-aways (people entering the country without being stopped by border patrol or other government agents).
These data show that unauthorized immigration inflows rose sharply after early 2021, peaked in early 2024 and then fell rapidly (Chart 2A). This decline began with a notable slowdown in notice-to-appear entries in early 2024, followed curtailed parole entries in late 2024 and finally, a sharp drop in notice-to-appear entries in January 2025. Since early 2025, the termination of several parole programs, tightened border enforcement and interior arrests have pushed unauthorized inflows to their lowest levels since the pandemic.
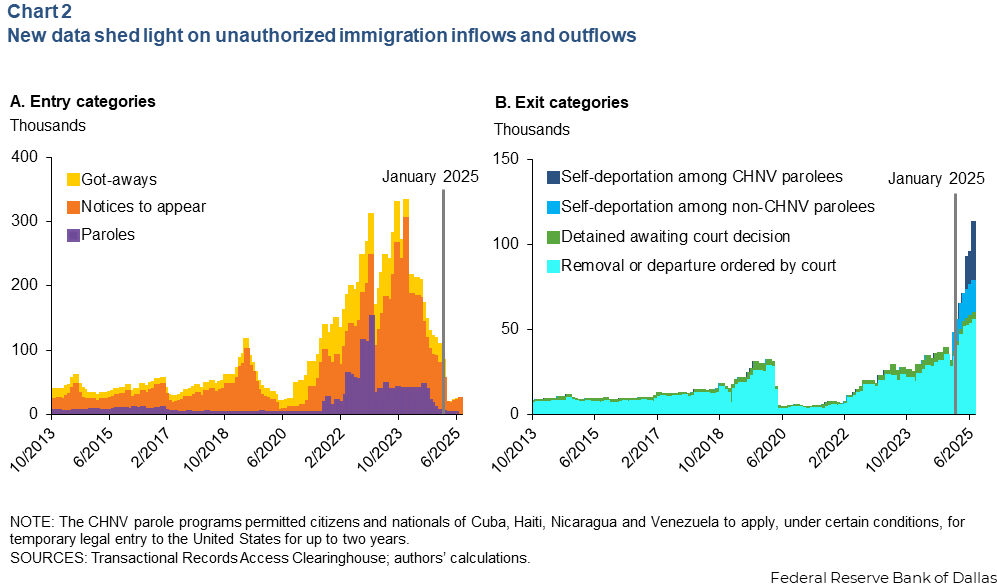
To estimate exits of unauthorized immigrants, we first use notice-to-appear microdata, which capture court-ordered removal, departure and detention (Chart 2B). (We follow the CBO in treating detentions as exits from the civilian noninstitutionalized population.)
We subsequently combine the parole microdata on age, country of origin and entry dates, with information on country-specific parole programs. We then estimate emigration (self-deportation) rates for got-aways and for parolees— whose program data are unavailable— based on previous aggregate entries and exit rates in the notice-to-appear microdata. This category of exits is the most difficult to estimate and comes with significant uncertainty. Exits have increased sharply since early 2025, driven by both removals and self-deportation.
Together, these estimates show that net unauthorized immigration has declined since January 2024 and has become increasingly negative since early 2025. The 2024 decline was primarily driven by a sharp drop in entries, reaching near zero by early 2025. The further net decline in 2025 reflects a steep rise in exits.
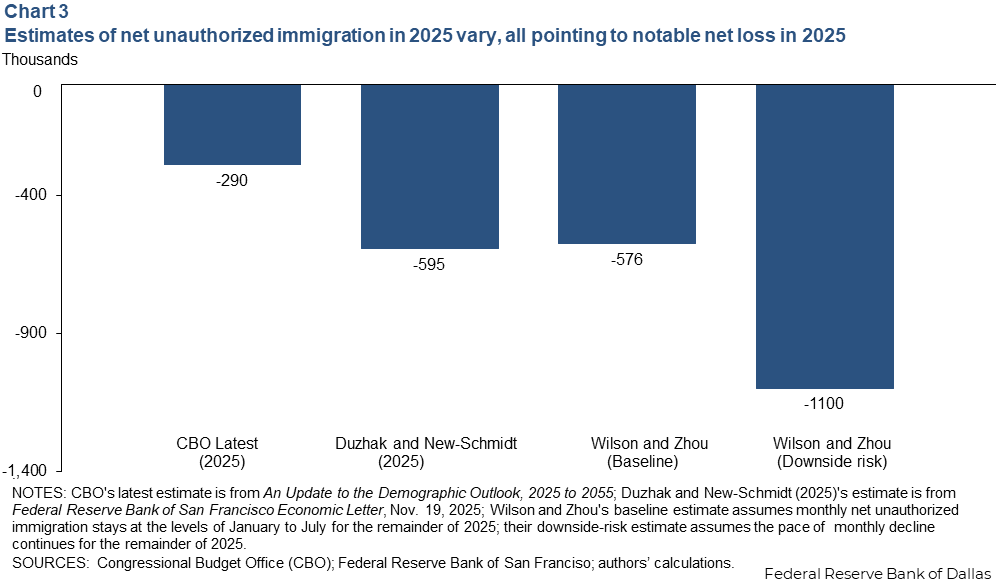
We estimate that net unauthorized immigration has averaged -48,000 monthly in 2025 through July. If that average holds constant through the remainder of the year, it would imply an annual total of –576,000. This is similar to the projection by Duzhak and New-Schmidt (2025), who combine ICE arrest data with aggregate data on other categories of entry and exit to project -595,000 in 2025. By contrast, the CBO’s latest projection for “other foreign nationals,” which assumes higher got-aways and lower removals than our estimate, is –290,000 in 2025 (Chart 3).
The pace of net unauthorized immigration has important implications for estimates of break-even employment growth, that is, the monthly change in employment consistent with a stable unemployment rate.
Net unauthorized immigration fell by an average of 24,000 per month between January and July and showed no sign of plateauing. If this pace of decline continued through year-end 2025, monthly net unauthorized immigration would average –95,000, almost four times the CBO’s projection.
After adjusting for the working-age employment share, this downside scenario would imply monthly break-even employment growth estimates about 40,000 lower than earlier estimates based on the CBO’s immigration projections.
Estimates of working-age adults, workers decline
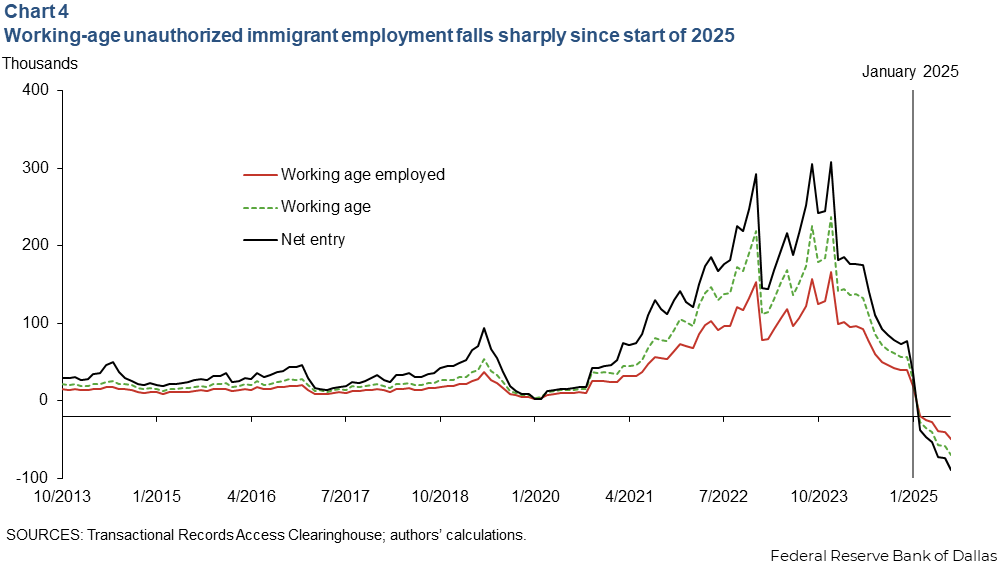
Demographic information in our microdata shows that after 2021, 75 percent of net unauthorized immigrants are of working age, well above the 62 percent for U.S.-born individuals. Since January 2025, working-age unauthorized immigration has averaged -37,000 per month and, like overall unauthorized immigration, shows no sign of flattening (Chart 4).
Since our microdata do not include employment information, we estimate historical employment rates using the American Community Survey for working-age immigrants who arrived in the U.S. within two years from high-encounter countries—those accounting for 90 percent of border enforcement encounters over the past three years.
Based on these rates, employment of unauthorized immigrants has contracted an average 26,000 per month through July 2025, or an annual equivalent decline of 310,000 people. However, if the recent pace of decline continues, these immigration outflows could result in a net loss of 51,000 unauthorized immigrant workers per month in 2025, or 612,000 for the year.
Estimates provide local labor market insights
Our microdata are particularly useful for assessing regional variation in unauthorized immigration, given that even large household surveys with geographic identifiers typically undercount unauthorized immigrants.
While our notice-to-appear microdata include ZIP code information based on immigrants’ addresses, comparable geographic information is unavailable for parolees and got-aways. To address this, we impute location-specific total inflows and outflows by scaling up the local notice-to-appear flows based on their shares of national flows. This approach ensures the sum of net unauthorized immigration across all locations matches the national total.
Chart 5 shows the number of net unauthorized immigrant workers of working age, expressed as a percent of each county’s initial employment, in U.S. counties during two periods—the surge, from early 2021 to early 2024, and the period of national net emigration, from February to July 2025.

During the surge period, counties in the West (California and much of the mountain west), the southern belt of states (Arizona, Texas and Florida) and the Northeast (particularly around the New York City metro area) experienced the largest immigrant worker inflows. These are also the areas where immigrants from high-encounter countries have historically settled.
In the net emigration period, these same counties have mostly experienced the largest outflows, suggesting potential further softening in these labor markets. Specifically, the correlation of net unauthorized immigration for counties in the surge-period and in the net emigration period is -0.96, indicating a very strong relationship.
Regional immigration differences merit further study
Detailed individual-level data from immigration courts and the Department of Homeland Security show that net migration has been increasingly negative since early this year, with no indication that the decline is stabilizing.
Additionally, these data show the geographic distribution of unauthorized immigration. In a follow-up study, we will further investigate this geographic variation to assess how these immigration swings have affected local labor markets.
About the authors

Daniel Wilson is a vice president in the Economic Research Department at the Federal Reserve Bank of San Francisco.

Xiaoqing Zhou is an assistant vice president in the Research Department at the Federal Reserve Bank of Dallas.