
Californians spend less on electricity than Texans despite higher prices
The rising cost of electricity has come at a time when availability of power and its price have been widely discussed as data centers for artificial intelligence applications rapidly expand.
Consumer costs and the ability to stay cool in the summer or warm in the winter are central talking points. Broadly viewed, affordability reflects total budget expenses relative to income. Texas is a low-cost state, especially relative to California.
California’s total residential cost of electricity is lower than that of Texas. More simply, however, electricity is a smaller portion of the household budget in California than in Texas.
State-level data reflects local conditions
States have broad authority to regulate their electricity markets, including how power is generated, transmitted and priced, and who bears responsibility for each step. Comparisons between California and Texas are common since both are large states with starkly different management and regulatory practices surrounding their electricity markets.
Comparing California and Texas also clarifies the key drivers of the total electricity cost burden to households.
Prices only tell part of the story
Discussions about the cost burden of electricity often begin and end with residential electricity prices (Chart 1).
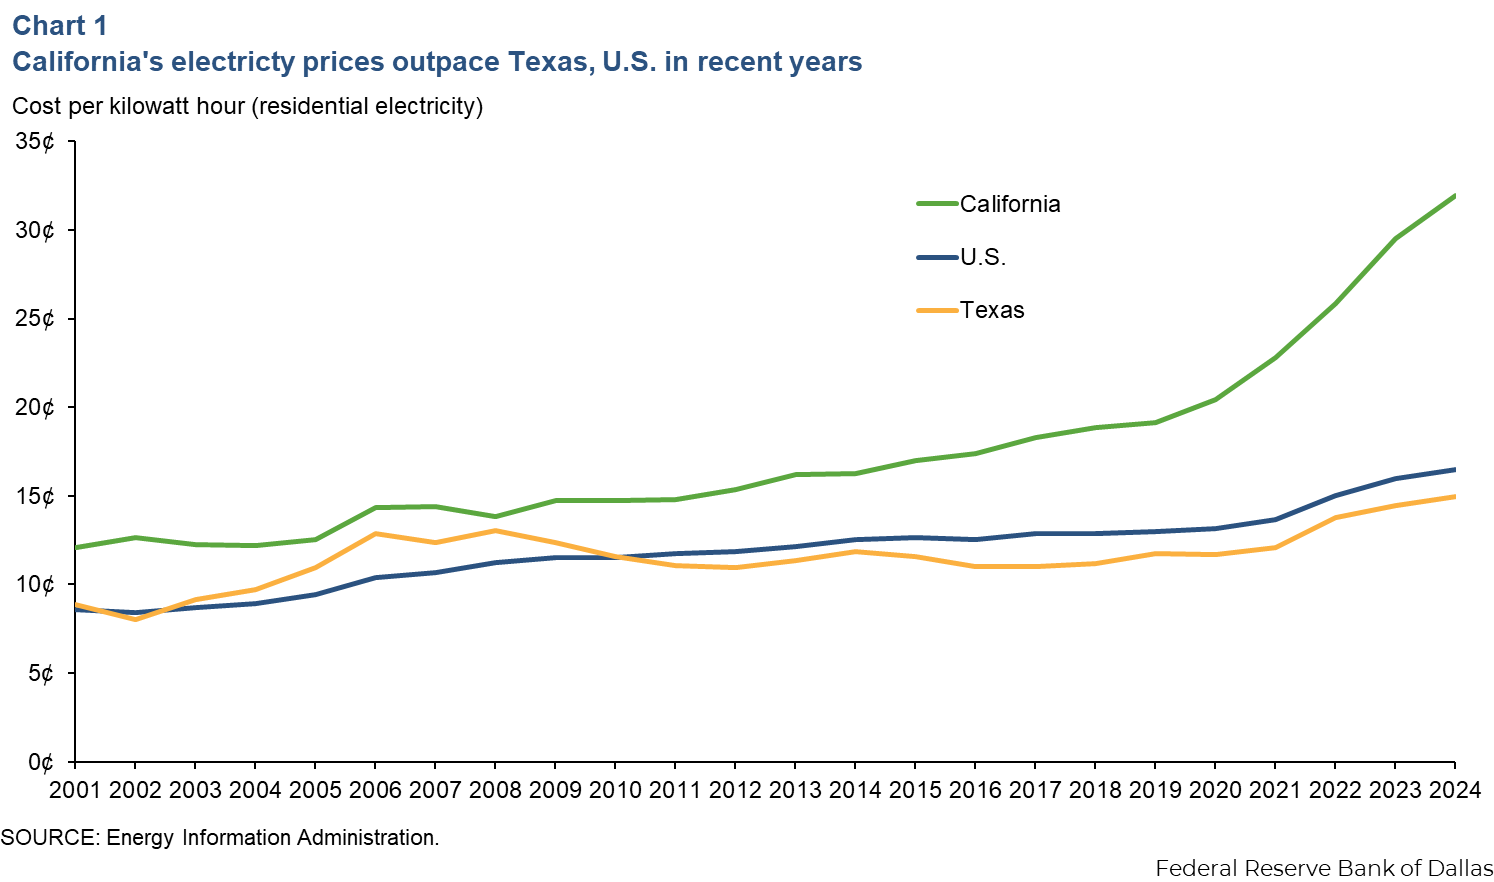
Retail electricity prices have increased in California faster than in both Texas and the nation, with nominal prices rising almost 75 percent in California, while climbing 36 percent in Texas and 28 percent nationally, from 2017 through 2024. However, price is only one component of household electricity cost; the other component is quantity.
Actual electricity usage drives household cost burdens
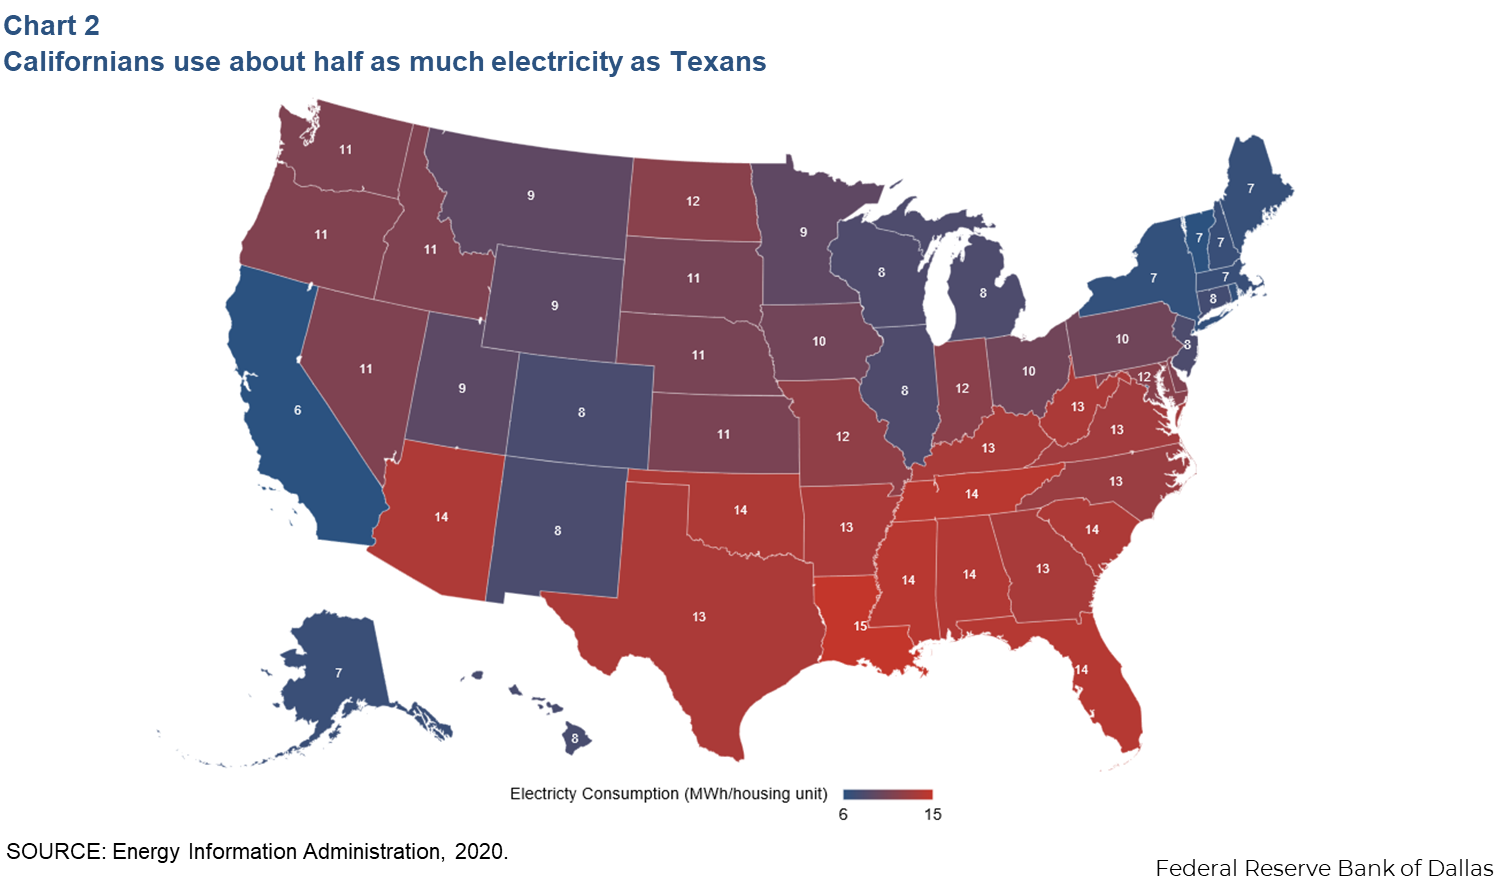
Californians consumed around half the electricity per household that Texans consumed as of 2020, around 6.5 megawatt-hours per household in California compared with around 13.5 megawatt-hours in Texas. Californians overall have some of the lowest household electricity usage in the country, comparable to New England or Alaska (Chart 2).
Why is this? Mostly, it’s because California has better weather. California has significantly fewer “cooling degree days” (high-temperature days) than Texas, leading to about 23 percent of California households having either no primary air conditioning or less overall air conditioning usage. By comparison, only around 2 percent of Texas households have no primary air conditioning.
It also matters how homes are heated in the winter. Winters in both Texas and California are moderate, with some regional variation. While California has more “heating degree days” (cold temperature days), more than 60 percent of Californians primarily heat their homes with natural gas. On the other hand, electricity is the primary source of heat in Texas, at nearly 70 percent of homes.
Once we consider what consumers actually spend on electricity by taking both effective prices and usage into account, the disparity between California and Texas is clearer (Chart 3).
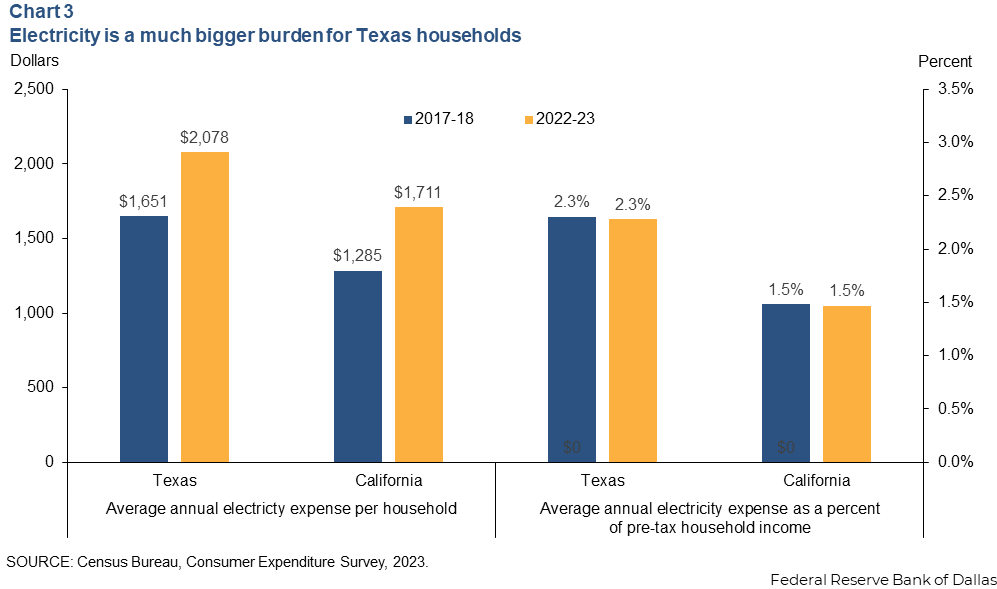
Because California households typically use less electricity than their counterparts in Texas, Californians can spend less on power overall despite higher prices. This is also true if we look at electricity costs as a percentage of pretax income, where Californians spent 1.5 percent compared with 2.3 percent for Texans, or about one-third less as a proportion of income. (The additional natural gas expense in California does not make up for this difference.)
Households do not necessarily think about the price of electricity when they budget, but rather what they need to budget for their total expected electricity expenses. This planning process considers the cost of the quantity of electricity demanded by household wants and needs.
To determine how burdensome electricity expenses are within a given population, it is important to understand how much electricity each subgroup of the overall population consumes and what drives that usage.
Residential solar plays a role
California’s residential solar program factors into the affordability differential, but it doesn’t clearly evidence itself in the household budget data, even when zooming in on specific income percentiles. Critics have raised the argument that Californians may actually pay more if we look within income groups and take into account policies that affect income groups differently, such as the solar program.
In Texas, each utility and locality can offer solar incentives if they wish, and there are relatively very few state-level incentives. By comparison, California allows consumers to sell excess power production back to the grid, reducing solar system owners’ power bills—a practice known as “net metering.”
Generous net metering raises the present value of installing solar systems, leading Californians to adopt residential solar at a rapid pace compared with other states with smaller or less centralized incentives, despite the upfront cost of solar installation.
In turn, this creates a distributional concern in California’s policy—utilities have large, fixed costs, which they recover through retail rate charges. By allowing solar system households to sell surplus electricity to the grid at a generous rate—in addition to reducing solar users’ bills through lowering overall grid usage—those without solar systems effectively foot a larger portion of the infrastructure bill than they otherwise would. This is known as “cost shifting.”
Solar system owners, nonetheless, often connect to grid power because they either do not have battery systems to store excess production during the day for use outside of sunny times, or their systems, including batteries, are insufficient to reliably meet all their electricity needs.
This dynamic means those without solar systems are, in some part, subsidizing the infrastructure costs for those with solar power. Moreover, since lower-income households are less likely to install solar panels given the upfront cost, there is reason to think this burden falls disproportionately on lower-income households.
Despite this, households in California remain below Texas households in terms of their electricity costs across income levels (Chart 4).
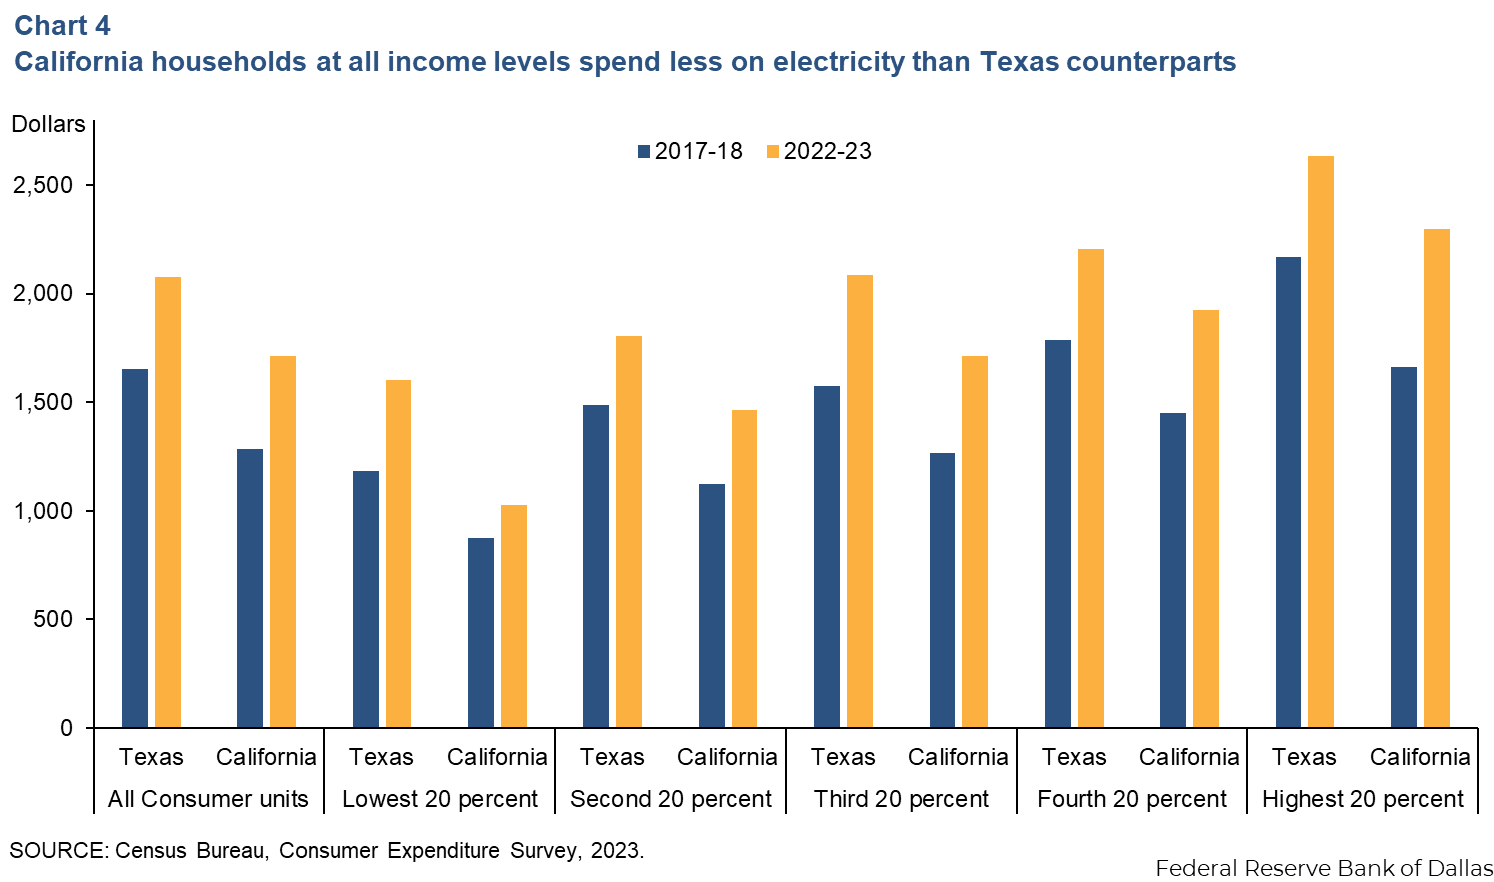
A typical California household in the lowest income quintile paid 26 percent less for electricity than similar Texas households in 2017–18. That differential rose to 36 percent in 2022–23. These dynamics follow, in part, from the California’s CARE program subsidizing the electricity cost of lower-income households.
The weight of California’s residential policy might disproportionately fall on middle- and lower-income households when they opt to not participate in the solar program. However, other subsidies available to these same consumers partially address this inequity.
Moreover, given recent changes that made California’s net metering policy less generous (in response to some of these concerns) coupled with California’s significantly higher incomes, it’s likely that California households’ electricity burden will remain lighter than Texas households’ for some time to come.
In sum, simply comparing retail costs per kilowatt hour provides an imperfect basis of comparison since such things as public policy, history and geography can affect both aggregate usage levels and per-unit prices, both of which ultimately determine a household’s final cost burden and affordability.
About the author

Cameron Barrett is a senior business economist in the Research Department of the Federal Reserve Bank of Dallas.