
Real-time house price model shows U.S. housing market firming
House prices matter to more than just individual homebuyers and sellers. They are closely tied to consumer spending, business investment and the broader path of the economy. Because a home is often the largest source of family wealth, price swings can materially impact how people spend, save and borrow.
When house prices rise, households gain confidence and spend more; when they fall, families often pull back, and growth tends to slow.
Problematically, official housing data arrive with a delay, sometimes by a month in some advanced economies and by much longer in others. That lag leaves policymakers flying partly blind when making critical decisions.
To close this gap, we build a current-quarter forecast, a statistical model that estimates current housing prices adjusted for inflation in real time using immediate indicators such as building permits, sales and new construction.
Our results, based on estimates available prior to the release of formal housing data, suggested that U.S. real house prices were likely to decline modestly in second quarter 2025, extending the weakness that began earlier in 2025, a somewhat fragile year for housing and labor markets.
The model further suggested a rapid worsening of conditions appeared unlikely in the second half of the year, even though risks remained elevated as uncertainty persisted.
Housing carries outsized economic footprint
Housing plays a central role in the U.S. economy not only because of its size, but also because of the way it connects to many other sectors. Housing typically accounts for 15 to 18 percent of U.S. GDP, or total economic output, through two main channels:
- Residential investment: building new homes, remodeling and brokers’ commissions.
- Housing services: rent and utilities paid by renters and imputed rent for owner-occupied homes (what homeowners would pay if they rented their own house).
But housing’s influence extends far beyond these direct contributions. Because homes are both places to live and major stores of wealth, changes in house prices ripple through the economy—shaping household spending, consumer confidence and even financial stability. Rising prices can boost wealth and make families feel more secure, while falling prices can trigger economic insecurity and cutbacks, delay moves and lead to mortgage stress.
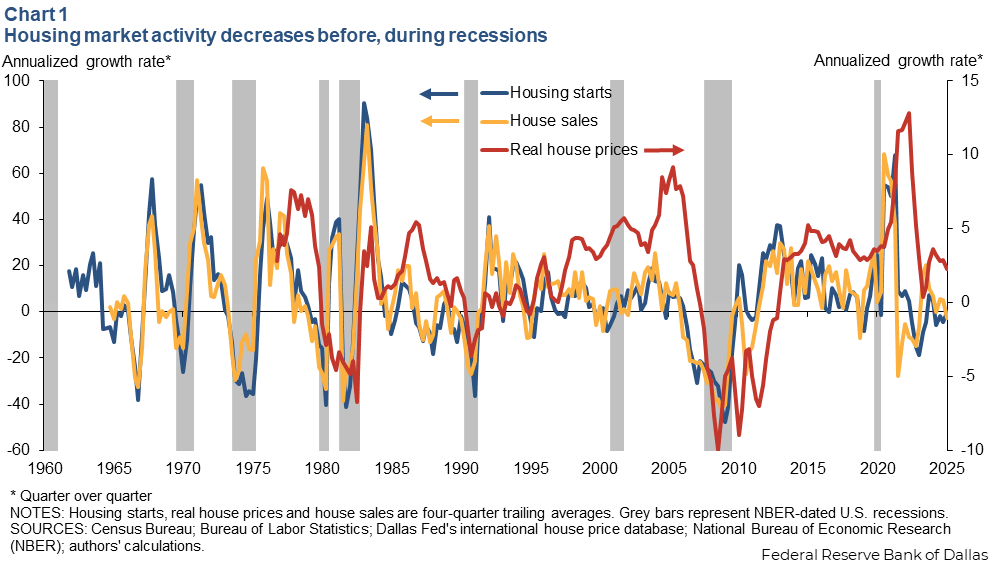
These dynamics also help explain why housing can act as a leading indicator of the broader economy. Activity in the housing market typically slows before and during a recession, signaling shifts in the overall business cycle before a downturn becomes fully visible in the macro data (Chart 1).
Real estate wealth supports consumption
Broadly, real estate wealth refers to the total market value of residential property. For homeowners, an important component of that is real estate equity—the share of a home’s value a homeowner truly owns, calculated as its market value minus the outstanding home mortgage balance.
Economists study how changes in real estate wealth affect household spending, often referred to as the wealth effect. The standard way of measuring the wealth effect is via the marginal propensity to consume—the fraction of each additional dollar of wealth that households spend rather than save.
Across studies, the evidence is remarkably consistent: Households typically spend 3 to 7 cents of every extra dollar of housing wealth. Carlos Cáceres estimates a marginal propensity to consume of about 4 cents per dollar of housing equity in the U.S., while Matteo Iacoviello and Marco Angrisani and coauthors place the effect on housing wealth closer to 6 cents, based on U.S. aggregate and household-level data, respectively.
John Campbell and João Cocco, using U.K. household data, report that elasticities of consumption with respect to house prices show strong heterogeneity by age and tenure. Older homeowners exhibit large positive responses, younger homeowners’ responses are much less (sometimes close to zero), and renters tend to respond negatively.
Housing wealth effect stronger during downturns
More recent evidence from Aditya Aladangady suggests a smaller effect—3 to 5 cents per dollar in the U.S. —highlighting that responses in normal times are more modest and shaped by leverage and liquidity constraints than during downturns.
These effects are not uniform across the business cycle; they become much stronger in downturns. Atif Mian and co-authors find a marginal-propensity-to-consume estimate of 5 to 7 cents per dollar of housing equity among U.S. households during the 2006–09 housing bust, with the largest responses in poorer and more indebted areas.
Marco Angrisani and co-authors likewise show that older U.S. households sharply adjusted their spending of real estate wealth during the 2008–09 Global Financial Crisis, with negligible responses in more stable periods. Aditya Aladangady reinforces this point, showing that collateral constraints amplify the response, meaning that during credit crunches households are even more sensitive to changes in real estate wealth than in normal times.
In sum, while studies differ by method, period and sample, the evidence consistently demonstrates that housing matters for consumption. Estimated marginal propensities to consume typically range between 3 to 7 cents per dollar, particularly among homeowners. For older or more credit-constrained households, and amid downturns, these estimates roughly double.
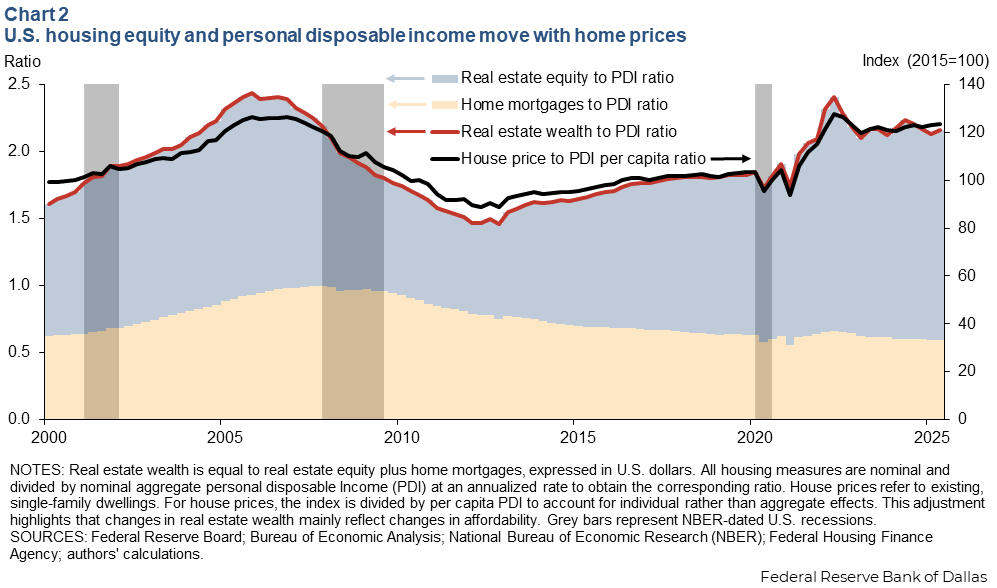
Thus, even modest swings in house prices can translate into sizable changes in aggregate spending through the housing wealth effect. Consistent with this mechanism, real estate wealth has fluctuated noticeably with house prices over time, even after adjusting for disposable income (Chart 2).[1]
Even small percentage changes in house prices can translate into meaningful shifts in household spending. For instance, if the value of a home rises by $10,000, research suggests a household might spend an additional $300 to $700 over a year in normal times—perhaps on travel, dining out or home improvements—illustrating the power of the link between house prices, real estate wealth and consumption.
Why house price swings matter
The strong wealth effect documented in the economics literature means that housing acts as an amplifier for the broader economy, increasing phases of expansion as well as contraction in the housing cycle.
- During an expansion, rising housing wealth makes families feel more financially secure. They may refinance mortgages, borrow against home equity or simply spend more freely. Builders increase construction, brokers earn more commissions and sales of durable goods climb, fueling faster overall growth.
Yet, when real house prices outpace the growth of real disposable income, affordability deteriorates. This shift raises housing wealth relative to income but can also sow the seeds for the next phase of adjustment, as stretched affordability eventually constrains demand. - During a contraction, falling home values erode housing wealth, prompting households to turn cautious. Families may delay car purchases, cancel vacations, or postpone remodeling projects. Some homeowners are left underwater, owing more than their homes are worth, which can raise defaults and reduce labor mobility as people can’t afford to sell and move on.
The Global Financial Crisis remains the clearest reminder of how powerful these swings can become. A body of research has pointed to signs of froth and speculative excess in the housing market that aggravated the imbalances preceding that crisis.
Rapid gains in housing wealth fueled borrowing and consumption, but when housing affordability became a drag and house prices fell, the sharp contraction in wealth and surge in foreclosures tightened household constraints and undermined the banking system. The resulting credit crunch deepened the downturn, amplifying negative wealth effects from housing and creating one of the deepest U.S. recessions in the post–World War II era.
Even outside of crisis episodes, housing wealth fluctuations matter. A 5 to 10 percent drop in aggregate real estate wealth can trim consumer spending by billions of dollars, slowing activity across sectors from construction to retail. Because housing wealth is so central to household balance sheets, its ups and downs act like an economic tide, lifting or lowering many boats at once.
This is why timely housing data are critical for policymakers. Yet, official statistics often arrive with delays, leaving decisionmakers steering the economy while looking in the rearview mirror.
Real-time forecasts fill the gap
A real-time forecast is essentially an early snapshot of the housing market. Rather than waiting for official price data, which are released with a lag, we rely on faster moving indicators that update more frequently to estimate current conditions.
Think of it like trying to predict the outcome of a soccer match at halftime. You don’t yet know the final score, but by looking at possessions, shots on goal and how the teams are playing, you can estimate where a game is headed.
Working with the International Housing Observatory and drawing on the Federal Reserve Bank of Dallas’s international house price database, we combine oft-changing monthly indicators related to housing with quarterly real house price data from the Federal Housing Finance Agency—that is, the all-transactions (single-family) nominal house price index, adjusted for inflation using personal consumption expenditures. This approach produces a monthly estimate of real house prices. Each time new monthly data become available, the model estimate refreshes.
We focus on the agency’s quarterly all-transactions series because it incorporates both purchase and refinance appraisals, making it a good gauge of the overall value of the housing stock and its implications for household wealth. Alternatives exist, such as the purchase-only index (available monthly, but for a small sample) that captures market trends more directly but doesn’t as clearly represent the full housing stock as the all-transactions series does.
Validating the empirical model
We started with 20 prospective indicators, among them labor market data, interest rates and construction permits. After testing, the best performing model included five key variables:
- Real GDP.
- Average sale price of new homes.
- Permits for new single-family houses.
- Housing starts.
- Sales of new single-family homes.
With this specification, the correlation between the observed quarterly real house price data and the estimated common component index from the model is very high (at 0.86).
To assess accuracy, we ran a forecasting exercise against several simple benchmark models, which rely only on past quarterly values of real house prices to forecast future periods absent the additional monthly and quarterly variables we included.
The process was straightforward: Estimate each model through a given quarter, forecast the next quarter and compare the prediction with the actual outcome. The difference between the forecast and the actual data is the forecast error.
We then extend the sample by one quarter and repeat the exercise. For example, using data through first quarter 2015, we forecasted second quarter 2015 and compared the result with actual data for second quarter 2015, before moving forward one quarter, re-estimating through second quarter 2015 to forecast third quarter 2015, and so on.
Most of the time, our model produces smaller forecast errors than the benchmarks (Chart 3). On average, the forecast error is 0.75, compared with 0.77 and 0.80 for the benchmark model alternatives. That consistency makes our model a more reliable tool for anticipating where real house prices are headed.
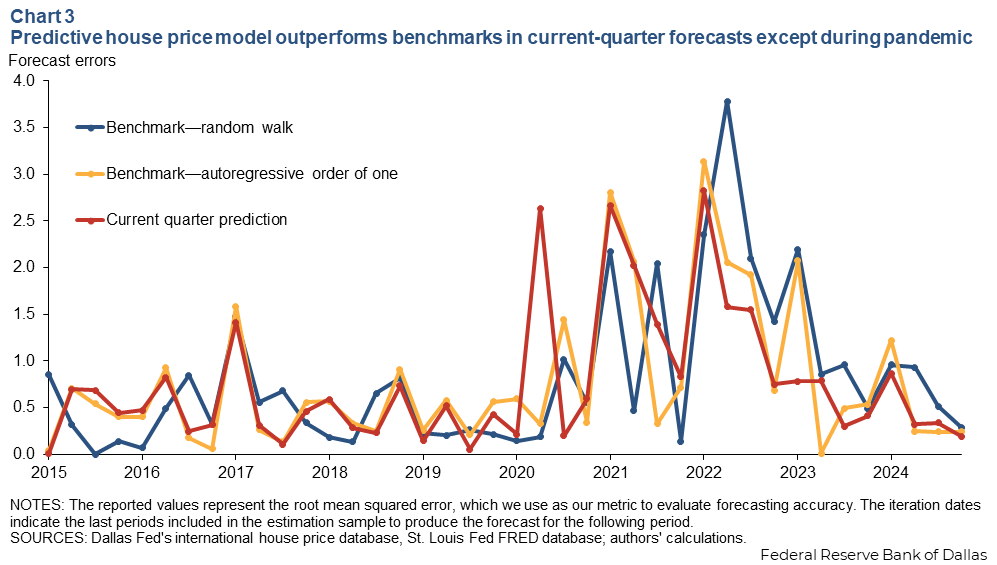
Pandemic provides extreme stress test
The pandemic was an extreme stress test and one of the few periods when our model clearly underperformed simpler benchmark models that rely only on past real house price movements. This is not unique to our case.
During 2020, forecasting models with a variety of macroeconomic variables struggled as lockdowns, policy interventions and rapid shifts in household preferences broke historical relationships, as documented by Schorfheide and Song and others.
For housing, the challenge was even more pronounced. Indicators that usually provide reliable signals became disconnected from actual house price movements. Sudden shifts in household behavior—including the tendency to acquire more living space, suburban living and remote work—reshaped housing demand in ways that prepandemic data could not fully anticipate.
Expectations also played a role, further weakening the link between indicators and contemporaneous house price movements. Against that backdrop, our model initially pointed to a steeper decline than occurred.
Forecast errors remained significant during 2020 and narrowed only as new information reflecting the changed environment accumulated.
The broader lesson is that even strong models can misfire when unprecedented shocks bend historical relationships. Adaptability helps—updating with timely, high-frequency data improves alignment over time—but keeping simpler time-series benchmarks in the toolkit is useful when historical relationships break down.
Longstanding benchmarks, while less sophisticated, can at times prove more robust than complex models when empirical economic relationships no longer hold.
Model points to shifting housing outlook as of August 2025
Our model illustration incorporated GDP data through second quarter 2025 and monthly indicators through July, and the model produces real-time, inflation-adjusted estimates of U.S. house prices as of mid-August 2025. This is a clear advantage over simpler models that rely only on past real house prices, which in August could only reflect data through first quarter 2025.
As of August, our model pointed to another decline in real house prices for second quarter 2025, similar to the 0.19 percent drop in the first quarter (Chart 4). That would have marked the first back-to-back decline since early 2023.
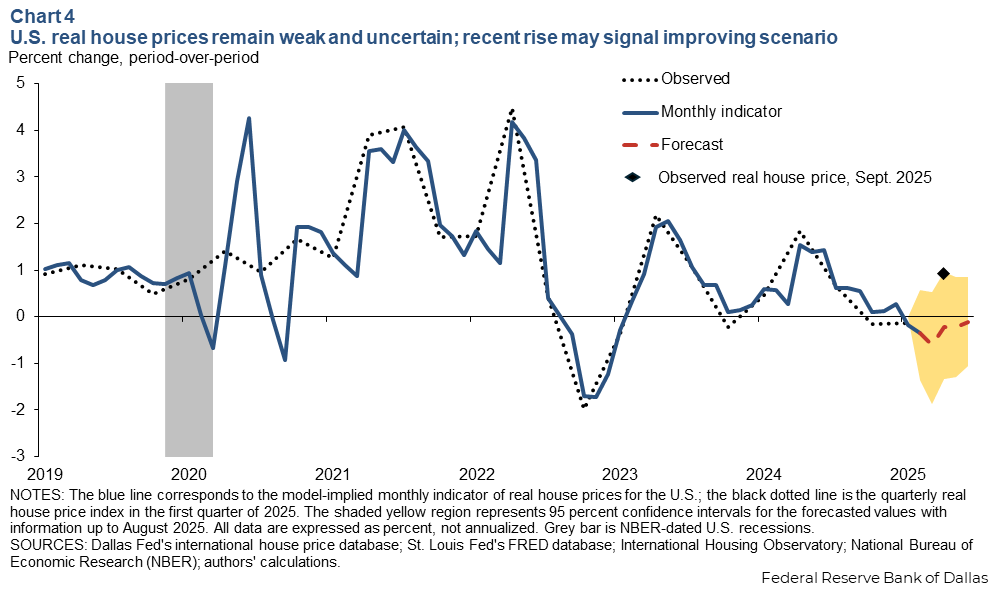
The current quarter forecast therefore suggested some cooling but also indicated that any contraction was likely to be tempered over time. Instead, the official data surprised to the upside—a 0.93 percent increase for second quarter released in September.
The monthly indicator, however, presents a more nuanced picture. The data showed signs of stabilization starting in May 2025, with the trend turning less negative even though the first quarter as a whole declined.
Importantly, the 95-percent confidence band around our forecast left room for positive growth—exactly what materialized—suggesting the downturn may be shallow rather than steep.
For households, this points to slower home price growth in real terms rather than a sharp correction, more a pause in momentum in 2025 than the onset of a severe decline.
Evidence points to firming housing market
Combining quarterly data with faster moving monthly indicators, our forecast model produces real-time estimates of house price dynamics. This approach provides an early warning tool for policymakers monitoring systemic risk, guiding monetary policy and safeguarding financial stability. It also gives communities, businesses and households a timelier sense of how housing markets are evolving—information that can shape borrowing, saving and investment decisions.
Our findings point to ongoing weakness in housing, but not the kind of correction that followed past bubble episodes. Even so, the risks warrant close monitoring.
Timely information can help policymakers make better decisions and keep the economy on a steadier course. For families and communities, it helps limit the chances that modest price swings turn into severe economic disruptions, protecting both household balance sheets and the broader economy.
Note
- Chart 2 displays the real estate wealth to disposable personal income (PDI) ratio. Housing wealth equals the average house price (P) times the stock of all dwellings (H), so the ratio can be expressed as (P•H)/PDI. Dividing numerator and denominator by population (N) gives (P•H)/PDI = (P/(PDI/N))•(H/N), where (P/(PDI/N)) is the price-to-income-per-capita ratio (a measure of affordability) and (H/N) is the housing stock per capita. Since the housing stock changes slowly, Chart 2 mainly reflects shifts in house prices relative to average income (affordability), though immigration may have more significantly shifted the per capita stock component in recent years.
About the authors

Tryg Aanenson is a research analyst in the Research Department at the Federal Reserve Bank of Dallas.

Erik Andres Escayola is a doctoral candidate in economics at the University of Alicante in Alicante, Spain.

Enrique Martínez García is an assistant vice president in the Research Department and co-director of the Global Institute at the Federal Reserve Bank of Dallas.

Efthymios Pavlidis is a professor of economics at Lancaster University Management School in Lancaster, U.K.

Iván Payá is a professor of economics at the University of Alicante in Alicante, Spain.

Kostas Vasilopoulos is a machine learning engineer at Pfizer and a former teaching associate in the department of economics at Lancaster University Management School.