El Paso: Gateway to Mexico relies on commerce, government
At a glance

Population (2023): |
872,063 |
Population growth (2016–23): |
3.6 percent (Texas: 9.5 percent) |
Median household income (2023): |
$58,800 (Texas: $76,292) |
National MSA rank (2023): |
No. 67* |
| *The El Paso metropolitan statistical area (MSA) encompasses El Paso and Hudspeth counties. | |
- Retail is among the largest clusters in El Paso. Health services, food services, and transportation and logistics are also important, reflecting El Paso’s proximity to Mexico and its trading relationship with neighboring Ciudad Juárez.
- Government is a major driver of the local economy, especially the federal government. Fort Bliss, the largest employer, is an important generator of local economic activity. It is likely to continue to play that role in the foreseeable future and may be affected by proposed resource reallocation.
- Robust manufacturing activity in Ciudad Juárez boosts El Paso’s service sector. However, moderating U.S. auto demand combined with uncertainty about tariffs and cross-border trade could slow economic activity. In addition, Mexican peso weakness and slower migration could temper retail sales north of the Rio Grande.
- El Paso was the most populous border metro in Texas until McAllen surpassed it in 2015.
History: The 'pass to the North' continues to connect the U.S. and Mexico
In 1848, before the Rio Grande marked the border between the United States and Mexico, the flags of Mexico and Spain flew over what would become El Paso. U.S. Army post Fort Bliss came into existence in 1854, five years before the city was formally founded in 1859.
El Paso was a small, quiet village for several decades until the railroad arrived in 1881. The city grew into a frontier boomtown called the “Six-Shooter Capital” and “Sin City” because of its saloons and gambling establishments.[1]
Over the years, more conventional industries emerged. Augmenting cotton production, copper smelting and oil refining entered the area and expanded the economy in the late 19th and early 20th centuries.
El Paso continues to straddle two nations, and its economy has been driven by flows of trade and people across the southern border. Growth in manufacturing in Ciudad Juárez, its sister city in Mexico, has contributed to El Paso’s prospects.
Industry clusters: Prime site for trade, government, retail
Clusters in Chart 4.1 are organized by location quotient (LQ)—the share of local employment in each industry cluster relative to the nation—and the change in employment share from 2016 through 2023.
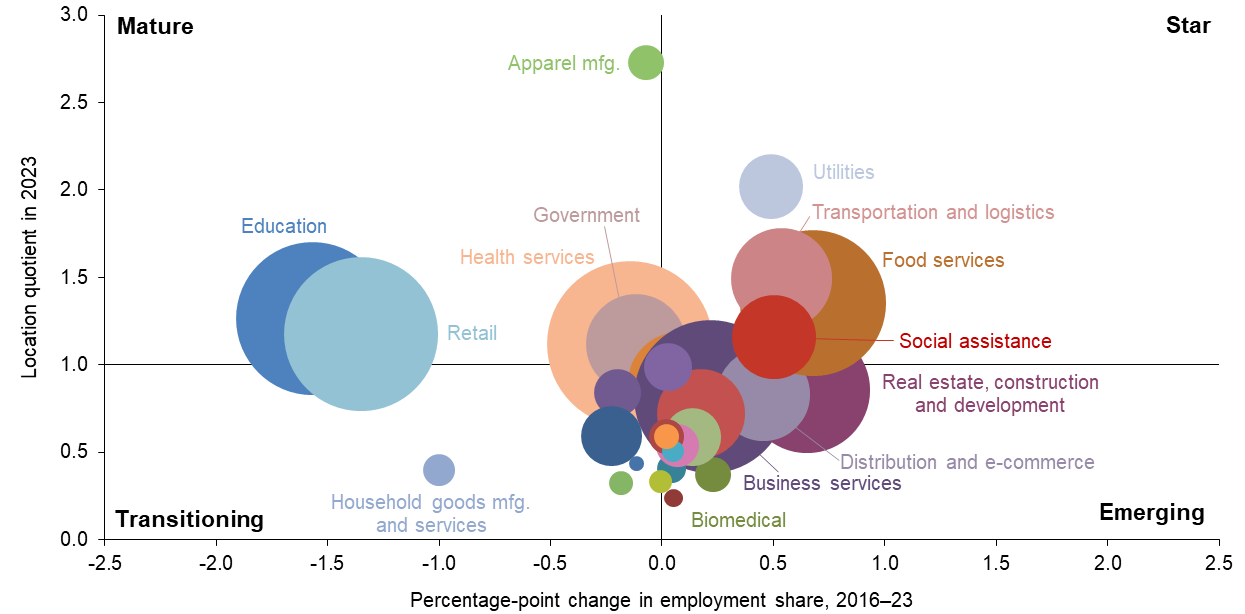
NOTE: Bubble size represents cluster share of metropolitan statistical area employment.
SOURCES: Texas Workforce Commission; Bureau of Labor Statistics.
“Star” quadrant clusters, such as food services, social assistance, and utilities, have large shares of employment relative to the nation (an LQ exceeding 1) and are relatively fast growing; “emerging” clusters are smaller relative to the nation (an LQ below 1) and fast growing. Clusters in the “mature” quadrant, such as education, retail and apparel manufacturing, are more concentrated but slower growing or shrinking in size, and “transitioning” clusters are smaller relative to the nation and slower growing or declining.
Food services and health services are key clusters of the El Paso economy, driven by the growing binational population and regional income gains. Dallas Fed research suggests the impact of pandemic border closures on local services may have been subsequently mitigated by federal government fiscal stimulus.[2]
Health services, the largest cluster, expanded 9 percent from 2016 through 2023, to 45,000 workers (Chart 4.2).[3] Large, private health care providers such as the Hospitals of Providence rank among El Paso’s top employers.[4] Major universities in the metro, including medical programs at the University of Texas at El Paso (UTEP) and Texas Tech University Health Sciences Center (whose teaching hospital opening was celebrated in 2017) also contribute to health services employment. The sector’s expansion bodes well for the region, as health services wages are slightly higher than average.
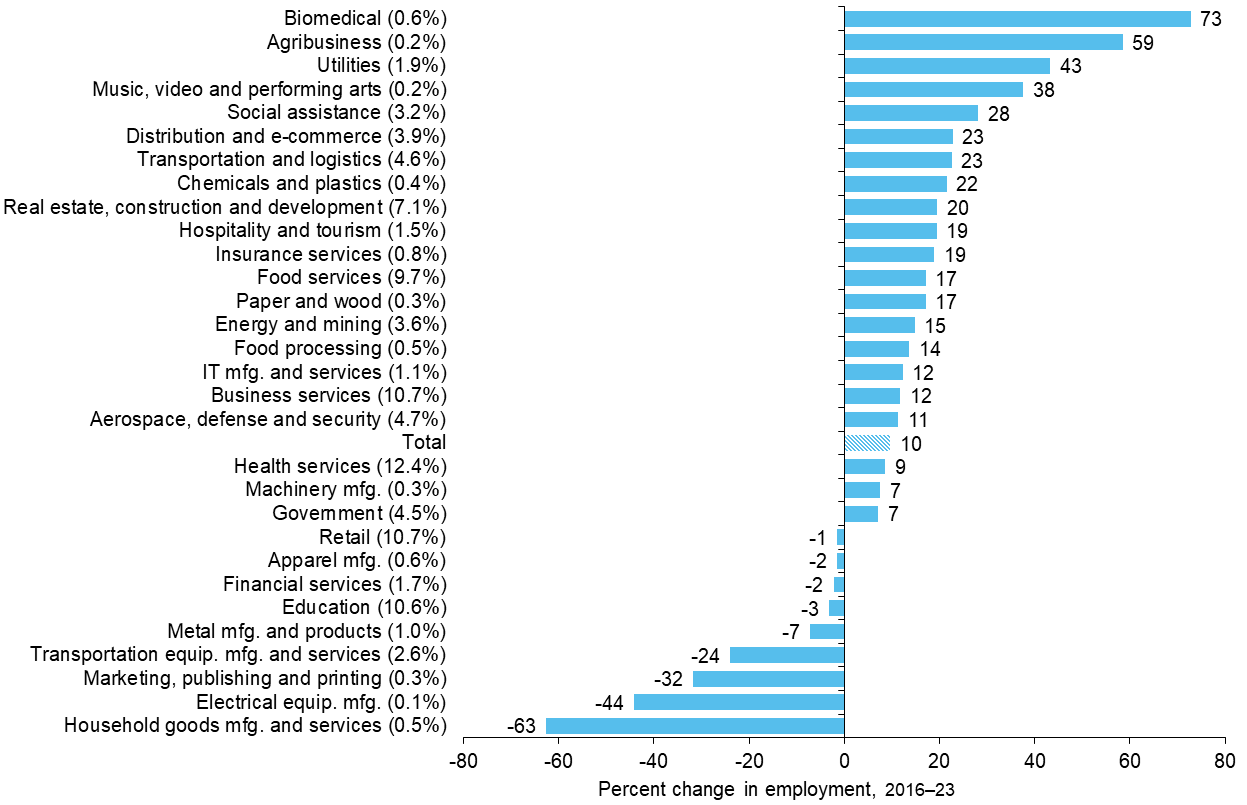
NOTES: Percent change in employment is shown in whole numbers. Each cluster’s share of total jobs is shown in parentheses (rounded to one decimal place). Clusters with employment shares less than 0.1 percent are not displayed.
SOURCES: Texas Workforce Commission; authors’ calculations.
Retail is the second-largest cluster in the metro, with 10.7 percent of El Paso employment. A strong relationship with neighboring Ciudad Juárez is important, as Mexican shoppers historically make up 10 to 15 percent of El Paso retail sales and are especially sensitive to exchange rate moves between the dollar and peso. With exchange-rate fluctuations and the rise of e-commerce, 2023 sector employment was nearly on par with its 2016 level.
Business services and education are the third- and fourth-largest clusters with over 38,000 jobs. The education sector is fueled by the 12 school districts, private and charter schools, UTEP, El Paso Community College and the Texas Tech Health Sciences Center. Although the sector is one of the area’s largest, employment fell 3.2 percent between 2016 and 2023. Employment in the business services sector, though less concentrated in El Paso than in the U.S., rose 11.8 percent between 2016 and 2023. Large employers in the sector include T&T Staff Management, a staffing services firm, which employs 7,800 people.
Government (excluding public sector health care, education, social assistance and aerospace employment) accounts for 4.5 percent of workers. Fort Bliss is the largest employer in the metro area and, according to the Texas Comptroller of Public Accounts, contributed $27.9 billion to the Texas economy in 2023.[5] The city of El Paso and federal Customs and Border Patrol are also major employers in the metro area.
El Paso is a historically important gateway from Mexico and the Southwest to the rest of Texas. Border crossings, trade with Mexico and the Interstate 10 corridor through El Paso make transportation and logistics an important cluster. About 25.3 million passenger vehicles, 6.3 million pedestrians and more than 800,000 loaded containers crossed the border in the El Paso customs district in 2023.[6] Additionally, cross-border manufacturing through the maquiladora industry stimulates employment in transportation and other support services.[7] Historically, a 10 percent increase in maquiladora output has been shown to increase El Paso’s transportation employment 5.3 percent.[8]
The dominant clusters do not pay as well as their less-concentrated counterparts, partly because of the type of clusters most represented in El Paso (Table 4.1). Retail and food services generally employ a large number of part-time workers, driving down overall average earnings, and even full-time employees in these clusters are paid low wages.
| Cluster | El Paso | U.S. | |||
| 2016 | 2019 | 2021 | 2023 | 2023 | |
| Apparel manufacturing | 37,569 | 35,792 | 36,061 | 34,010 | 56,257 |
| Utilities | 74,694 | 69,408 | 71,584 | 63,877 | 106,251 |
| Transportation and logistics | 49,684 | 52,938 | 52,482 | 52,564 | 65,167 |
| Food services | 18,337 | 18,384 | 19,434 | 19,785 | 25,821 |
| Education | 49,217 | 49,816 | 54,169 | 50,328 | 66,490 |
| Retail | 31,520 | 32,849 | 34,998 | 34,293 | 39,817 |
| Social assistance | 25,903 | 25,510 | 25,080 | 25,163 | 33,136 |
| Government | 52,441 | 53,155 | 54,500 | 56,666 | 67,435 |
| Health services | 52,716 | 52,291 | 54,977 | 54,684 | 69,397 |
| Transportation equipment manufacturing and services | 45,612 | 47,411 | 52,044 | 57,244 | 66,929 |
| Clusters with location quotient > 1 | 43,740 | 43,755 | 45,533 | 44,861 | - |
| Clusters with location quotient <= 1 | 54,764 | 53,694 | 55,679 | 54,278 | - |
| Average earnings (total) | 45,740 | 46,321 | 47,859 | 47,007 | 70,033 |
| NOTES: Clusters are listed in order of location quotient (LQ); clusters shown are those with LQs greater than 1 in 2023. Earnings are in 2023 dollars. SOURCES: Texas Workforce Commission; Bureau of Labor Statistics; authors' calculations. |
|||||
In recent years, because of elevated inflation and labor shortages, real (inflation-adjusted) earnings in some sectors were lower in 2023 than in 2016, while wages in other sectors rose as firms fought for scarce workers. For example, real earnings in social assistance fell 3 percent from 2016 through 2023. At the same time, real wages in retail and food services increased 8.8 and 7.9 percent, respectively, during the period. Wages in El Paso remain below the U.S. average in every cluster, though cost-of-living differences compensate for some of the disparity.
Demographics: Population reflects border proximity
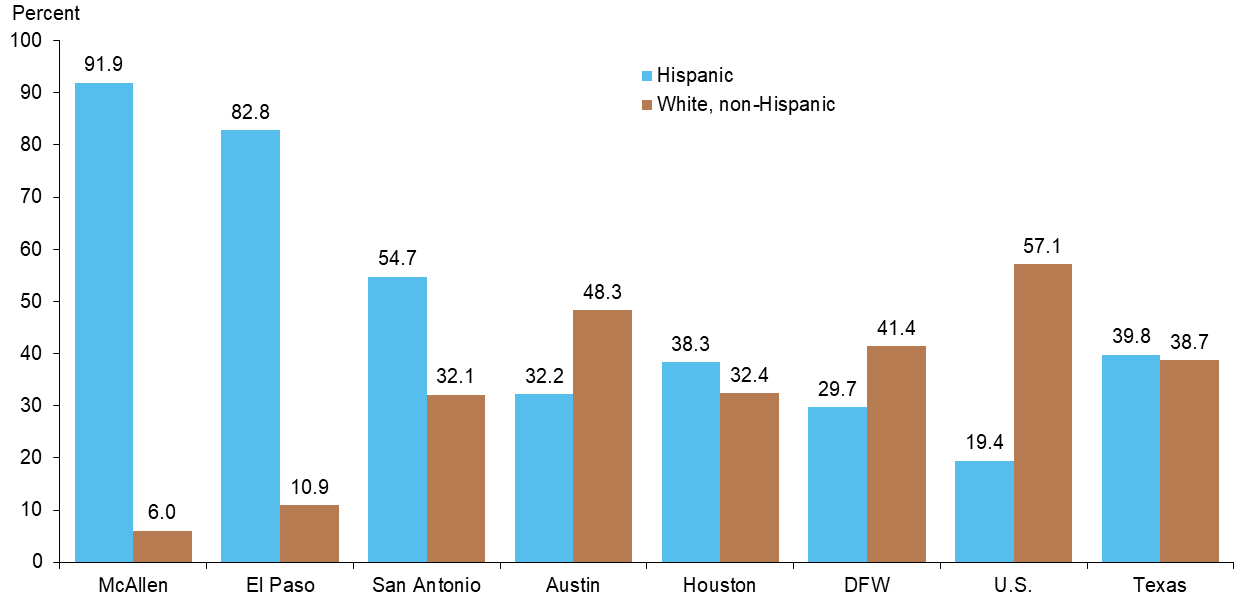
El Paso’s population is predominantly Hispanic, with 82.8 percent of residents self-identifying as Hispanic, the second-highest percentage among the metros in this report behind McAllen (Chart 4.3). Slightly less than a quarter of El Paso’s population in 2023 was foreign-born, with 89.1 percent of these immigrants born in Mexico.
SOURCE: Census Bureau, 2023 American Community Survey 1-year estimates.
In measures of education, El Paso residents trail those of other Texas metros. Among El Paso adults age 25 or older, 81.0 percent had at least a high school diploma in 2023. That figure is 5 percentage points lower than the Texas average. Only 25.9 percent of adults had a bachelor’s degree or higher, compared with 34.2 percent for Texas.
Though relatively low, these shares are an improvement from 2016, when 78.9 percent of adults had a high school education and 22.5 percent had a bachelor’s degree. These education levels are in line with the large immigrant population in El Paso—immigrants tend to make up the very extremes of the education distribution. The education profile is also reflected in the composition of El Paso’s industry clusters; some of the most concentrated clusters do not require highly educated workers.
Employment: Jobs recover from the pandemic faster than the nation but behind the state
El Paso’s pandemic employment recovery has been stronger than that of the nation but weaker than the state. Using monthly data, El Paso employment dropped 11.6 percent from February to April 2020 amid pandemic shutdowns, about even with the state but less than the 14.4 percent decline nationwide. Metro employment returned to the February 2020 level in December 2021, two months after Texas employment recovered and six months before the U.S. did.
El Paso’s employment in December 2024 was 8.4 percent above the February 2020 level compared with 9.7 percent statewide. The sectors driving this employment recovery include business services, food services and health services, which all recovered quickly after the pandemic dip. On the other hand, manufacturing and mining employment remain below February 2020 levels.
Outlook: Education, border trade uncertainty cloud prospects
The labor force’s relatively low education level complicates El Paso’s outlook. A relative dearth of skilled labor makes the metro less attractive to businesses looking to expand in high-skilled sectors. Additionally, residents and prospective residents with those enhanced skills tend to look elsewhere for employment, lured by more abundant opportunities.
On the upside, health services is expected to continue expanding given the aging population and expansion of local medical programs. Fort Bliss is an economic generator, and current levels of defense spending should buoy local base operations.
Finally, El Paso’s economy is heavily tied to Mexico due to the cross-border trade of goods and services, exemplified by maquiladora activity, which since mid-2023 has experienced declining employment in Juárez. The drop partly reflects rising labor costs along the northern border of Mexico, prompting firms with labor intensive production to shift or consider relocating production to other parts of Mexico or to Central America, areas with even lower wages.
Even though recent supply-chain issues hit firms and a strong peso made operating in Mexico more expensive initially during the pandemic, the promise of future nearshoring projects could bring more transportation, utilities and business services jobs to the metro.[9] These jobs tend to pay better and require more skills than the average position in El Paso, which could have ripple effects through the metro’s economy. However, expanded tariffs would curtail economic growth in the metro, given its dependence on cross-border manufacturing.
| El Paso growth outlook | |
| Drivers | Challenges |
|
|
Notes
- The history of El Paso has been adapted from the Texas State Historical Association’s Handbook of Texas.
- “Federal aid helps border keep pace with Texas economy during pandemic turmoil,” Dallas Fed Economics, March 1, 2022.
- The percentage shares of individual clusters are normalized to add up to 100 and differ from individual industry share totals. Some industries are included in multiple clusters, while some others are omitted because they fall outside revised cluster definitions. (See the appendix for more information.)
- Detail on top employers in the El Paso metro area is from the city of El Paso, accessed Aug. 19, 2025.
- See Texas Comptroller’s report on impact of Fort Bliss on the Texas economy in 2023, accessed Aug. 19, 2025.
- Border crossings data from the Bureau of Transportation Services and from U.S. Customs and Border Protection.
- Maquiladoras are manufacturing operations in Mexico that assemble imported components into exportable products that are free of import and export duties.
- “The Impact of Maquiladoras on U.S. Border Cities,” by Jesus Cañas, Roberto Coronado, Robert W. Gilmer and Eduardo Saucedo, Growth and Change, vol. 44, no. 3, September 2013, pp. 415–42.
- Nearshoring is the practice of moving production closer to the United States, to countries such as Mexico, from distant offshore locations, most recently from China.