
Break-even employment declines as unauthorized immigration outflows continue
Recent employment reports showing softer U.S. payroll growth have prompted questions about the health of the labor market. Properly interpreting these numbers requires a benchmark: the break-even rate of employment growth, the number of net new jobs needed each month to keep the unemployment rate constant.
Using newly available microdata that measure net unauthorized immigration through December 2025, we update previous estimates of break-even employment growth (“Break-even employment declined after immigration changes,” Cheremukhin [2025]). Our framework combines demographic trends and labor force participation dynamics to estimate the pace of job growth consistent with a stable unemployment rate.
The updated estimates show that continued net outflows of unauthorized immigrants, together with shifts in labor force participation, have pushed the monthly break-even employment growth lower than previously thought.
Net unauthorized immigration outflow restrains job growth
Net unauthorized immigration is a key input in our framework for constructing break-even employment growth. This category of immigration surged during 2021–24 and then declined sharply, accounting for most of the variation in break-even employment growth in recent years. However, reliable estimates of such immigration have been limited.
Using high frequency individual-level immigration court data combined with other administrative records through July 2025, previous work estimated that net unauthorized immigration plummeted after early 2024 and turned negative—indicating net outflows—beginning in February 2025 (“New data show intensifying unauthorized immigration decline, with large local variations,” Wilson and Zhou [(2026]).
We extend this analysis through December 2025 using microdata on immigration court records obtained through Freedom of Information Act requests by the Transactional Records Access Clearinghouse at Syracuse University. These data allow us to measure entries and enforced deportations of unauthorized immigrants. We also revise our estimates of voluntary exits (self-deportations) to reflect country-specific changes in the effective termination dates of Temporary Protected Status, which provides protection from removal.
Our updated estimates indicate that net unauthorized immigration has remained negative since February, averaging -55,000 per month in the second half of 2025 (Chart 1). These net outflows reflect high levels of removal orders by immigration courts and self-deportations, as well as very low levels of new entries.
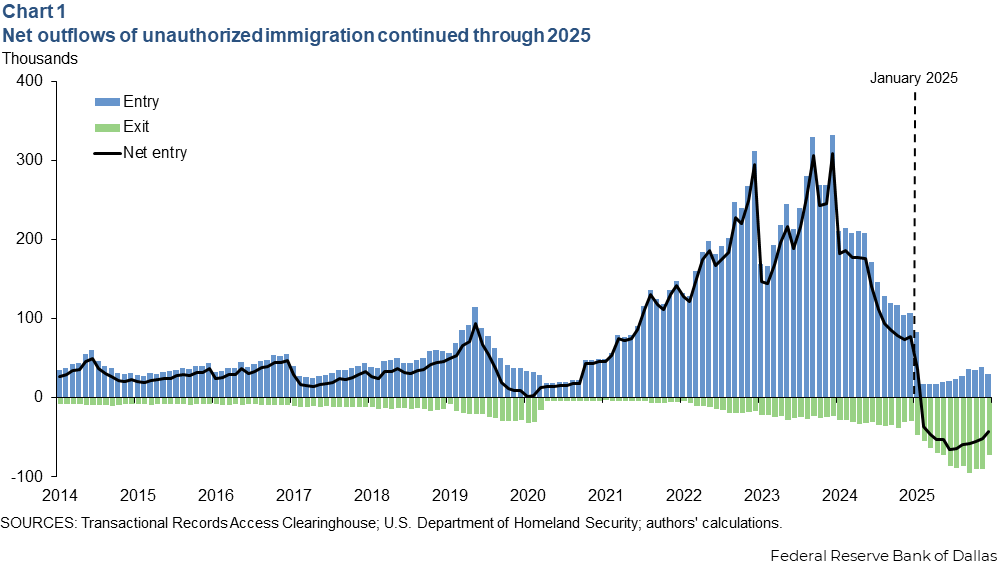
Yet there also are preliminary signs of stabilization. The pace of exits has slowed somewhat in recent months, while entries have increased slightly. This uptick in entries should be viewed with caution. For individuals in the immigration court data with missing entry dates, our methodology assigns their entry to the month in which they received their initial “Notice To Appear” in immigration court. This approach aligned well with actual entry timing in most cases prior to 2025. The share of individuals with missing entry dates, however, has increased in recent months.
That said, the uptick in entries over 2025 has a minimal effect on our estimates of net unauthorized immigration (contributing less than 7,000 per month) and an even smaller effect on break-even employment (on the order of 3,000 jobs per month).
Despite the recent stabilization, total net unauthorized immigration for 2025 reached -548,000, about 50 percent larger in magnitude than the Congressional Budget Office’s latest projection of -365,000.
The immigration microdata also allow us to estimate the working-age, likely employed component of net unauthorized immigration. According to a recent Federal Reserve Bank of Dallas working paper, these immigrant worker flows increased measured payroll employment one-for-one in recent years.
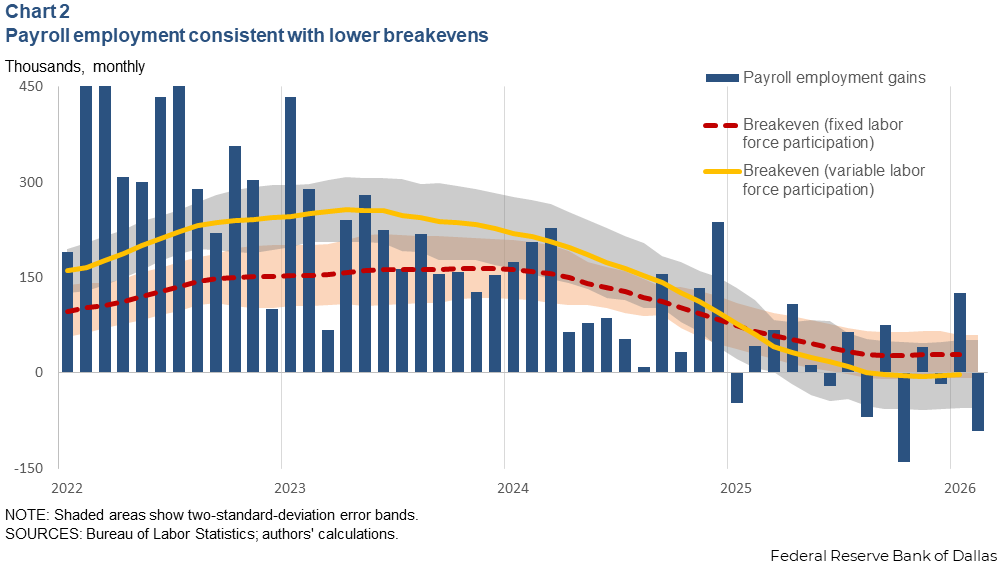
Incorporating these updated estimates of net unauthorized immigration into our full model—allowing the labor force participation rate to vary over time—yields substantially lower break-even employment growth than previously estimated (Chart 2, yellow line). The break-even rate peaked at about 250,000 jobs per month in 2023, fell to roughly 10,000 by July 2025, and declined to near zero thereafter, averaging about –3,000 jobs per month from August to December 2025, indicating, if anything, a modest net jobs loss over this period.
Labor force participation drop amplifies demographic drag
Break-even employment depends not only on population growth, but also on the share of the population participating in the labor force. Recently, the demographic headwind from immigration has coincided with a gradual decline in labor force participation.
In real time, it is difficult to disentangle how much of this decline reflects changing economic conditions versus other factors. Rather than imposing a fixed behavioral response, our framework uses a smoothed participation trend, applying a rolling average to filter out month-to-month fluctuations. This approach captures the observed trajectory of the available workforce at any given point in time.
To illustrate the role of labor force participation dynamics, we consider a counterfactual scenario in which the labor force participation rate remains constant (Chart 2, red line). Because we construct break-even employment growth from the growth rates of its underlying components, assuming a constant participation rate removes its contribution to job growth.
This scenario—isolating the impact of demographic changes alone—implies break-even employment growth of about 30,000 jobs per month by the end of 2025, down from 160,000 in 2023. Thus, movements in labor force participation amplify the demographic forces in determining break-even employment growth.
Updated break-even estimates do not point to labor market slack
Comparing our break-even estimates with actual payroll growth (Chart 2, blue bars) suggests that job growth over the recent three months—December 2025–February 2026—has slightly exceeded the break-even rate on average, consistent with the unemployment rate remaining stable despite softer headline payroll numbers.
Real-time data point to an important change in the U.S. labor market: The benchmark for evaluating payroll growth has moved significantly. As net outflows of unauthorized immigrants reduced employment growth in late 2025, payroll gains that might historically have signaled economic slack are now consistent with a balanced labor market.
About the authors

Anton Cheremukhin is a principal research economist in the Research Department of the Federal Reserve Bank of Dallas.

Daniel Wilson is a vice president in the Economic Research Department at the Federal Reserve Bank of San Francisco.

Xiaoqing Zhou is an assistant vice president in the Research Department at the Federal Reserve Bank of Dallas.