Fort Worth–Arlington–Grapevine: Transportation-related sectors predominate in local economy
At a glance

Population (2023): |
2.6 million |
Population growth (2016–23): |
8.1 percent (Texas: 9.5 percent) |
Median household income (2023): |
$83,059 (Texas: $76,292) |
National MSA rank (2023): |
No. 4* (Dallas–Fort Worth) |
| The Fort Worth-Arlington-Grapevine metropolitan division is part of the Dallas–Fort Worth metropolitan statistical area (MSA) and encompasses Johnson, Parker, Tarrant and Wise counties. The population of the Dallas-Fort Worth MSA is 8.1 million. | |
- Fort Worth began as an outpost marking Texas’ western frontier. Rail connections and a central location for cattle drives helped establish the city’s identity as “Cowtown,” a moniker that endures.
- In the years surrounding World War II, Fort Worth emerged as a hub for the aviation and defense industries, key elements of the local economy today.
- Fort Worth’s blue-collar workforce provides a ready labor supply for the energy, manufacturing and construction sectors, but an inflow of finance, aerospace and services firms marks a shift toward attracting a more white-collar workforce.
History: Cowtown takes off with aviation
Fort Worth, established as an Army fort near the Clear Fork of the Trinity River in 1849, is named after Mexican–American War hero U.S. Army Gen. William Jenkins Worth. He had proposed a series of 10 forts from Eagle Pass to North Texas to mark the western Texas frontier. Shortly after Fort Worth’s inception, settlers began moving in and, by 1860, had established the city as a county seat. However, its initial growth spurt didn’t occur until after the Civil War.[1]
Once a wayside for cowboys on cattle drives to Kansas, Fort Worth attracted the interest of cattle buyers and meatpackers and acquired the nickname “Cowtown.” The Texas Pacific Railway completed a route linking Fort Worth with San Diego in 1876—the first in a series of railroad ties—and the city caught the attention of Armour and Co. and Swift and Co. Local citizens assembled a $100,000 incentive to entice the companies. Both began slaughterhouse operations in 1903, helping draw a burgeoning livestock trade to north Fort Worth.
Following the discovery of oil in Texas in 1901, refinery and pipeline firms came to Fort Worth. Oil and gas companies increased their foothold during the oil boom of the 1980s and following the more recent discovery of large natural gas deposits in the nearby Barnett Shale.
With World War II, the aviation industry established a major presence in the form of the Consolidated Aircraft Corp. (later acquired by General Dynamics Corp. and now part of Lockheed Martin Corp.). Carswell Air Force Base (now Naval Air Station Joint Reserve Base Fort Worth), part of the Strategic Air Command, was located next door. The siting of Dallas/Fort Worth International Airport (DFW) in 1973 on the Tarrant–Dallas county line and subsequent relocation of American Airlines nearby have continued to link the city to the aviation industry. Perot Field Fort Worth Alliance Airport, opened in 1989, ranks among the nation’s 25 largest cargo airports and a hub for Amazon’s air cargo operations.[2]
Industry clusters: Transportation and logistics, aerospace and defense pace growth
Location quotients (LQs), which compare the relative concentration of various industry clusters locally and nationally, can be used to assess key drivers in an area’s economy. An LQ exceeding 1 indicates a specific industry cluster is more dominant locally than nationally. Industry cluster growth is measured by the percentage-point change in its share of local employment between 2016 and 2023 (Chart 5.1).[3]
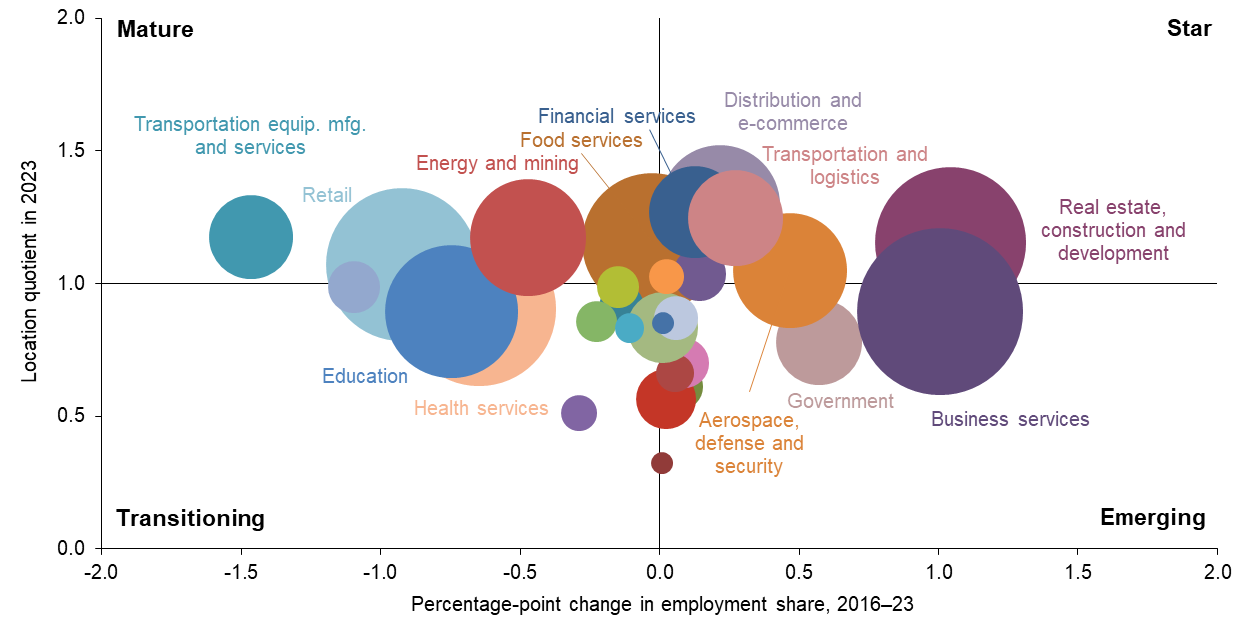
NOTE: Bubble size represents cluster share of metropolitan statistical area employment.
SOURCES: Texas Workforce Commission; Bureau of Labor Statistics.
Clusters in the top half of the chart have larger shares of employment relative to the nation and, thus, an LQ exceeding 1. These clusters are generally vital to the area’s economy and can be expanding relatively rapidly (“star”) or slowly (“mature”). Those in the bottom half are less dominant locally than nationally and, hence, have LQs below 1. “Emerging” clusters are fast growing; those growing slowly or declining are “transitioning.”
The high LQs of distribution and e-commerce, financial services, and transportation and logistics reflect their outsized roles in the metro area. Not surprisingly, BNSF Railway, among the largest freight railroad operators in the United States with approximately 37,000 employees across the country in 2023, is headquartered in Fort Worth along with Ben E. Keith Co., a large foodservice distributor of foods, beer, energy drinks, spirits and wine.[4]
In the financial sector, the Fort Worth suburb of Westlake in Denton County is the headquarters of the brokerage firm Charles Schwab, which relocated to the area from San Francisco in 2021. Nearby, another global financial services provider, Fidelity Investments, maintains an expansive corporate office, while Big Four accounting firm Deloitte has a campus and learning center. The Fort Worth area is also home to GM Financial, the financial services arm of General Motors.
The energy and mining cluster makes up 5.7 percent of the area’s employment, though its footprint has slowly contracted. Fort Worth was a commercial center for the oil industry early in the last century and enjoyed easy access to the Permian Basin to the west. Although the region sits atop the Barnett Shale formation, a prolific source of natural gas, persistent price weakness has prompted retrenchment in the sector. The shift also impacted landmen, whose work role is highlighted in the TV drama series filmed largely in Fort Worth and inspired by the region’s energy heritage.
Fort Worth’s largest industry clusters drive essential activity and development. These include business services, retail and health services. Business services, which experienced employment growth of 27 percent during the 2016–23 study period, is the largest cluster and was among the fastest growing over the period (Chart 5.2). Financial services, also a star and accounting for 3.5 percent of area employment, grew 21 percent. Taiwan-based Wistron Corp. announced a $761 million supercomputer manufacturing facility using existing buildings in the Alliance area, which is expected to serve growing artificial intelligence demands. The project, in association with industry leader Nvidia, could signal a widening development frontier for the region as the build-out proceeds into 2027.
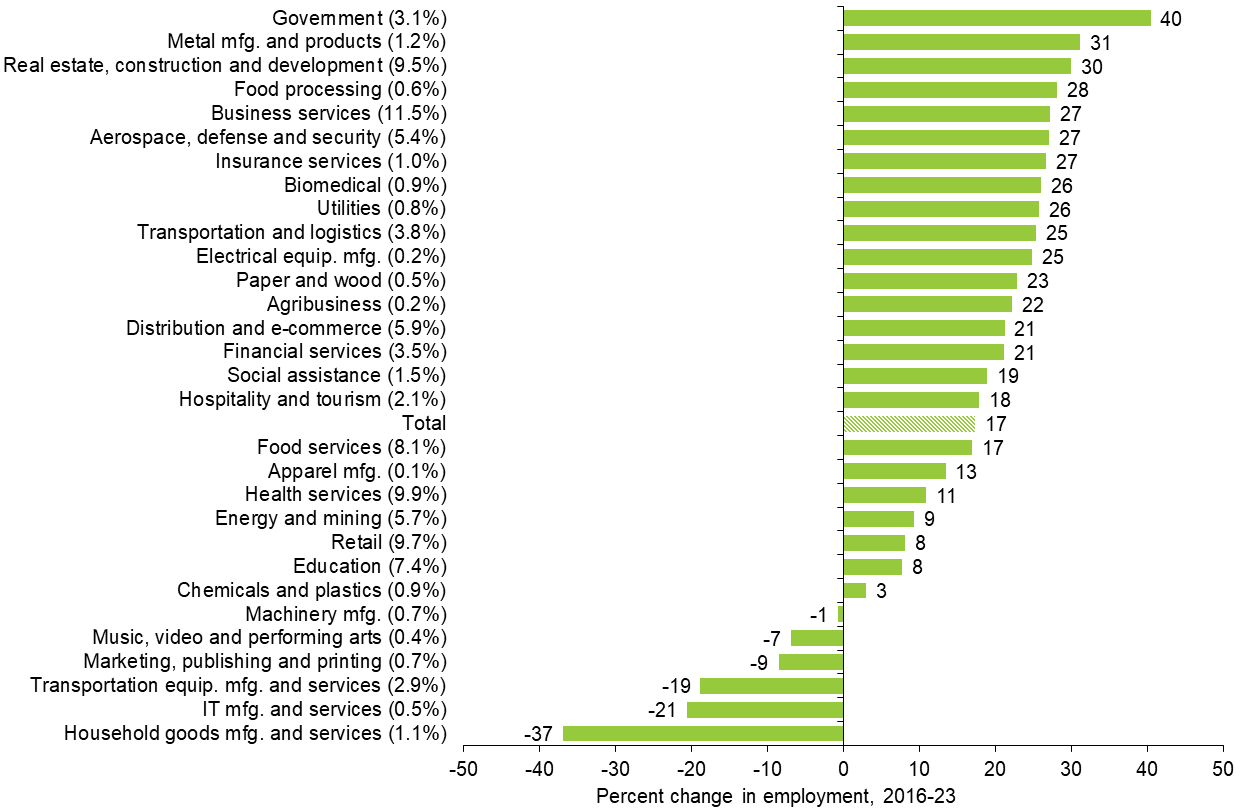
NOTES: Percent change in employment is shown in whole numbers. Each cluster’s normalized share of total jobs is shown in parentheses (rounded to one decimal place). Clusters with employment shares less than 0.1 percent are not displayed.
SOURCES: Texas Workforce Commission; authors' calculations.
The highly visible though smaller hospitality and tourism cluster, which grew 18 percent, includes Arlington’s Six Flags Over Texas amusement park. Arlington is the site of two premier sports facilities, AT&T Stadium, where the Dallas Cowboys football team has played since moving from Irving in 2009, and Globe Life Field, home of the Texas Rangers baseball team, which opened in 2020. The Rangers’ former home, now called Choctaw Stadium, hosts a variety of sporting events. Nearby Grand Prairie is the home of a performance venue as well as Lone Star Park, a horseracing track, and a cricket stadium.
The aerospace, defense and security cluster, which includes Lockheed Martin Corp. and Bell Textron, accounts for 5.4 percent of area employment and grew 27 percent from 2016 through 2023. DFW Airport, Perot Field Fort Worth Alliance Airport and the Joint Reserve Base are also major activity hubs. The much smaller transportation equipment manufacturing cluster (2.9 percent of area employment) has a significant concentration and plays a major role in the area’s economy. General Motors has operated an automobile assembly plant in Arlington since 1954. The plant employs 5,200 workers and specializes in large sport utility vehicles.[5]
Real estate, construction and development, the fourth-largest cluster—classified as a star among the metro’s clusters—expanded 30 percent over the study period. Among area companies is the nation’s largest homebuilder since 2002, D.R. Horton, No. 123 in the Fortune 500 list in 2025, and Acme Brick Co.[6]
The education sector plays an increasingly pivotal role in the area’s economy, boosting productivity and innovation. Major institutions such as Texas Christian University (TCU), University of Texas at Arlington (UTA) and Texas A&M–Fort Worth are making capital investments. TCU has enhanced its education footprint with the opening of its Burnett School of Medicine in 2024.[7] UTA is launching its 51-acre campus in west Fort Worth and will welcome its inaugural class in fall 2028.[8] Texas A&M is developing a downtown Fort Worth campus anchored by its law school and research and innovation building.[9]
On average, clusters with greater employment concentration locally than nationally paid employees $70,000 annually, almost identical to those with a relatively smaller presence. However, within more concentrated clusters, average pay varies widely. The financial services cluster (LQ of 1.3) pays well, at $98,200, whereas aerospace, defense, and security (LQ of 1.05) pays $104,100. By comparison, the larger food services and retail clusters (both straddling the mature category) were the lowest paying, at $23,800 and $40,300 a year, respectively (Table 5.1).
| Cluster | Fort Worth | U.S. | ||||
| 2016 | 2019 | 2021 | 2023 | 2023 | ||
| Distribution and e-commerce | 68,978 | 73,585 | 71,076 | 72,259 | 83,656 | |
| Financial services | 90,778 | 92,589 | 98,546 | 98,216 | 120,489 | |
| Transportation and logistics | 58,181 | 61,143 | 60,945 | 59,432 | 65,167 | |
| Transportation equipment manufacturing and services | 54,526 | 55,695 | 60,846 | 67,030 | 66,929 | |
| Energy and mining | 86,674 | 89,183 | 84,696 | 93,211 | 107,531 | |
| Real estate, construction and development | 70,354 | 73,243 | 74,840 | 75,671 | 75,369 | |
| Food services | 21,963 | 23,081 | 23,636 | 23,765 | 25,821 | |
| Retail | 38,872 | 39,123 | 42,369 | 40,316 | 39,817 | |
| Aerospace, defense and security | 102,581 | 105,897 | 107,088 | 104,057 | 108,638 | |
| Metal manufacturing and products | 65,148 | 67,532 | 65,686 | 67,810 | 71,037 | |
| Paper and wood | 61,485 | 63,490 | 67,092 | 66,281 | 65,903 | |
| Clusters with location quotient > 1 | 68,820 | 67,836 | 67,491 | 69,823 | - | |
| Clusters with location quotient <= 1 | 67,249 | 70,873 | 70,792 | 71,075 | - | Average earnings (total) | 63,218 | 65,482 | 66,401 | 65,913 | 70,033 |
| NOTES: Clusters are listed in order of location quotient (LQ); clusters shown are those with LQs greater than 1 in 2023.
Earnings are in 2023 dollars. SOURCES: Texas Workforce Commission; Bureau of Labor Statistics; authors' calculations. |
||||||
Demographics: In-migration key to growth
Fort Worth and its larger neighbor, Dallas, make up the Dallas–Fort Worth metroplex, the fourth-largest MSA in the country, with 8.3 million people in 2024.[10] New residents from abroad and elsewhere in the United States accounted for 73 percent of the population growth from 2020 to 2024, and the metro area took the top spot nationally for total net migration over the period.
Fort Worth is 46 percent white, 29 percent Hispanic or Latino, 15 percent black and 5 percent Asian. Nearly 16 percent of the Fort Worth area population is foreign born, with 41 percent of immigrants from Mexico. In 2023, Fort Worth’s median household income (the midpoint at which half of incomes are above and below) was $83,059, higher than the U.S. median of $78,538 but trailing its neighbor, Dallas ($89,301).
Consistent with the area’s manufacturing and construction emphasis, 34.4 percent of people ages 25 and older hold a bachelor’s degree or higher, less than Dallas at 42.6 percent and the U.S. at 36.2 percent, but on par with Texas at 34.2 percent (Chart 5.3). The share of adults with only high school diplomas or less in Fort Worth (36.7 percent) exceeds the share in Dallas (32 percent).
NOTE: Share of population age 25 and over.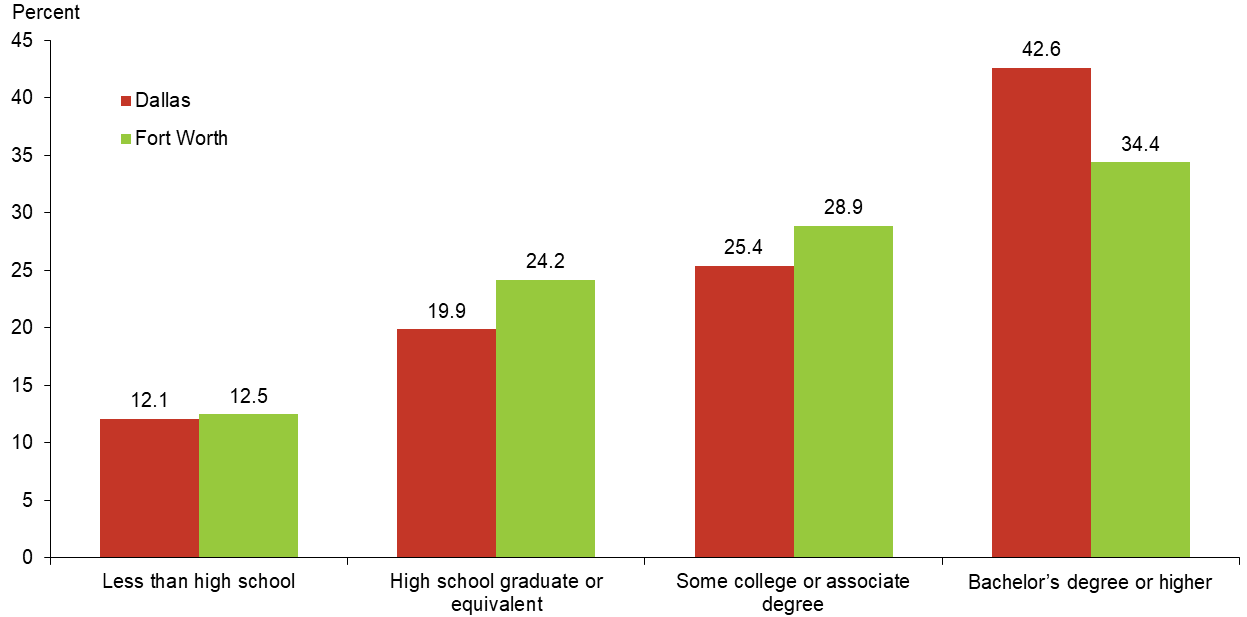
SOURCE: Census Bureau, 2023 American Community Survey one-year estimates.
Employment: Solid post-pandemic recovery
The Fort Worth economy proved resilient during and after the pandemic. Area employment grew 14.6 percent from February 2020 to December 2024—trailing Austin but largely in line with other major Texas metros. Employment expansion was broad based, with growth particularly strong in construction, professional and business services, and leisure and hospitality. The Fort Worth unemployment rate was low at 3.8 percent in December 2024, which was below the state (4.2 percent) and U.S. (4.1 percent) rates.
Outlook: Transportation and logistics, defense and real estate shape Fort Worth’s trajectory
Although sometimes viewed as a single economic unit with Dallas, the Fort Worth region has a unique and complementary industry profile, with a greater relative concentration in transportation, aviation and defense, energy, retail, and real estate and construction. In the near term, those industries’ performances will help set the course for Fort Worth, as will the fast-growing influx of business and financial services firms.
While logistics has been an expanding sector that should prove to be a driver in the future, shifting trade policy has increased uncertainty. The commercial and residential real estate market has slowed in part as interest rates rose in the postpandemic period. Rapid increases in home prices and rents over the past several years have reduced overall housing affordability, though Fort Worth remains more affordable than the Dallas metro area.
Federal government budget priorities will likely help set the long-term outlook for the historically powerful aerospace, defense, and security cluster and the 5.4 percent of the jobs it represents. Record-high oil production in the state should continue to boost growth in the energy and mining cluster although the sector is price-sensitive. Moreover, growth in the financial services sector has helped diversify the metro area’s employment base beyond its traditional reliance on manufacturing and energy. Promising new development of data centers may further broaden the area economy.
| Fort Worth–Arlington–Grapevine growth outlook | |
| Drivers | Challenges |
|
|
Notes
- The history of Fort Worth is taken from the Texas State Historical Association’s Handbook of Texas.
- Data for air freight transportation rankings are from Bureau of Transportation Statistics.
- The percentage shares of individual clusters are normalized to add up to 100 and differ from individual industry share totals. Some industries are included in multiple clusters, while some others are omitted because they fall outside revised cluster definitions. (See the appendix for more information.)
- Information about BNSF is taken from the BNSF website.
- Information about GM workers is taken from the GM website.
- Information about DR Horton is taken from the DR Horton website.
- Information about TCU’s School of Medicine is taken from the TCU website.
- Information about UTA West campus is taken from the UTA website.
- Information about Texas A&M–Fort Worth expansion is taken from the Fort Worth Economic Development Partnership website.
- The 2024 population estimates are from the Census Bureau. The three largest metropolitan statistical areas are New York–Newark–Jersey City, Los Angeles–Long Beach–Anaheim and Chicago–Naperville–Elgin.