Lubbock: Texas Tech, agriculture work together in plains economy
At a glance

Population (2023): |
360,342 |
Population growth (2016–23): |
14.8 percent (Texas: 9.5 percent) |
Median household income (2023): |
$62,288 (Texas: $76,292) |
National MSA rank (2023): |
No. 155* |
| *The Lubbock metropolitan statistical area (MSA) encompasses Cochran, Crosby, Garza, Hockley, Lubbock and Lynn counties. | |
- Texas Tech University and agriculture have shaped Lubbock’s development since the early 20th century.
- Health services, education and retail are major contributors to economic activity.
- A large student population helps explain the area’s relatively low median household income and disproportionate population shares of 15–24 year olds and college degree holders relative to the overall state.
- The South Plains metro has struggled to retain its young people, including new college graduates.
History: Rooted in agriculture and education
Lubbock’s settlers came in search of land to cultivate in the late 1800s. Other settlements dotted the West Texas plains, though Lubbock’s growth stood out, driven by the railroad. The city was formally established in 1909, and later that year, the Santa Fe Railway arrived. Lubbock’s 1910 population doubled over the following decade, to 4,051 residents in 1920.
In 1923, the Legislature designated Lubbock as the home of Texas Technological College, known as Texas Tech University since 1969. Agriculture remained a vital component of economic activity, particularly cotton and sorghum farming. By the mid-20th century, Lubbock accounted for a major portion of the global cottonseed-processing industry.[1]
Industry clusters: Education, health lead area economy
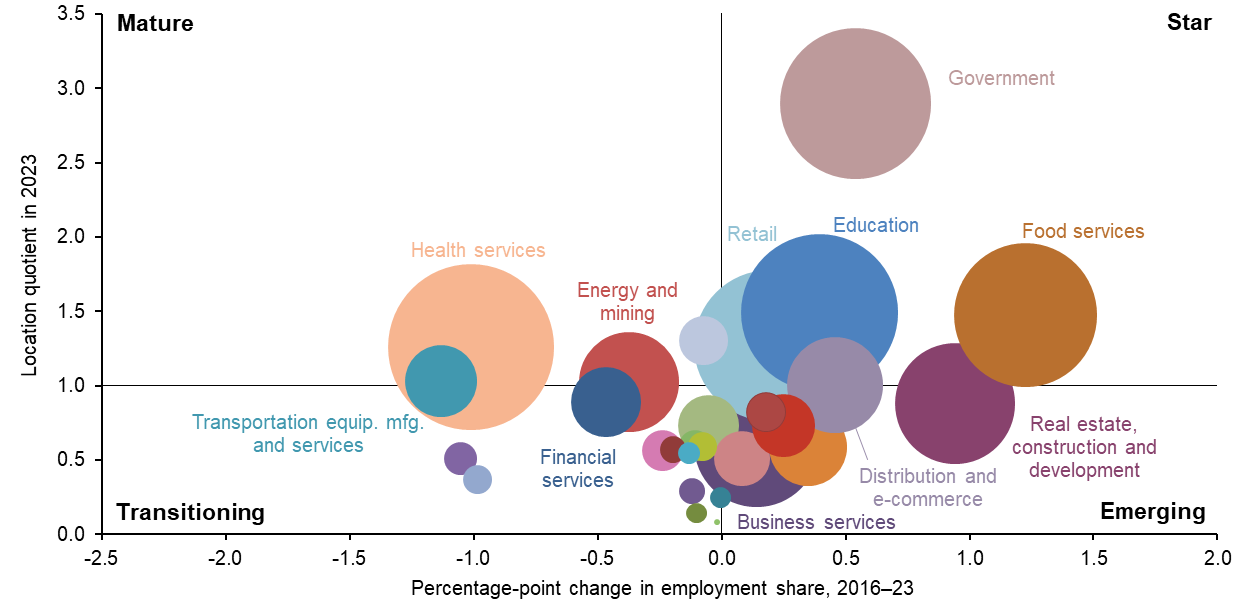
Location quotients (LQs), which compare the relative concentration of various industry clusters locally and nationally, are a convenient way of assessing key drivers in an economy. An LQ exceeding 1 indicates that a specific industry cluster carries more relative weight locally than nationally.
Clusters in the top half of Chart 12.1, such as education and food services, have a larger share of employment relative to the nation and, thus, an LQ greater than 1. These clusters are generally vital to the area’s economy and can be expanding relatively rapidly (“star”) or slowly (“mature”). Those in the bottom half, such as financial services and business services, are less dominant locally than nationally and, hence, have an LQ less than 1. “Emerging” clusters are fast growing; those growing slowly are “transitioning.”

NOTE: Bubble size represents cluster share of metropolitan statistical area employment. Clusters with employment shares less than 0.1 percent are not displayed.
SOURCES: Texas Workforce Commission; Bureau of Labor Statistics.
Health services, Lubbock’s largest industry cluster, encompasses more than 13.3 percent of the metro’s total employment and is 1.3 times more concentrated in Lubbock than in the U.S. on average.[2] Major health services employers include Covenant Health and UMC Health System, which together employ 9,000 people. University Medical Center is a public hospital serving as the primary teaching hospital for the Texas Tech University Health Sciences Center, training 400 students annually for careers in nursing and medicine.[3]
Retail, education, food services and government are among Lubbock’s other large clusters by employment. The retail and government clusters each account for 11.0 percent of the workforce and are in the “star” cluster quadrant, amounting to 1.3 and 2.9 times the clusters’ concentration in the U.S.
Education makes up 11.9 percent of Lubbock’s employment and is 1.5 times as concentrated in Lubbock as the U.S. average (Chart 12.2). Lubbock’s school districts and the many colleges in the metro—including Texas Tech, Lubbock Christian University and Wayland Baptist University—are major employers in the sector.

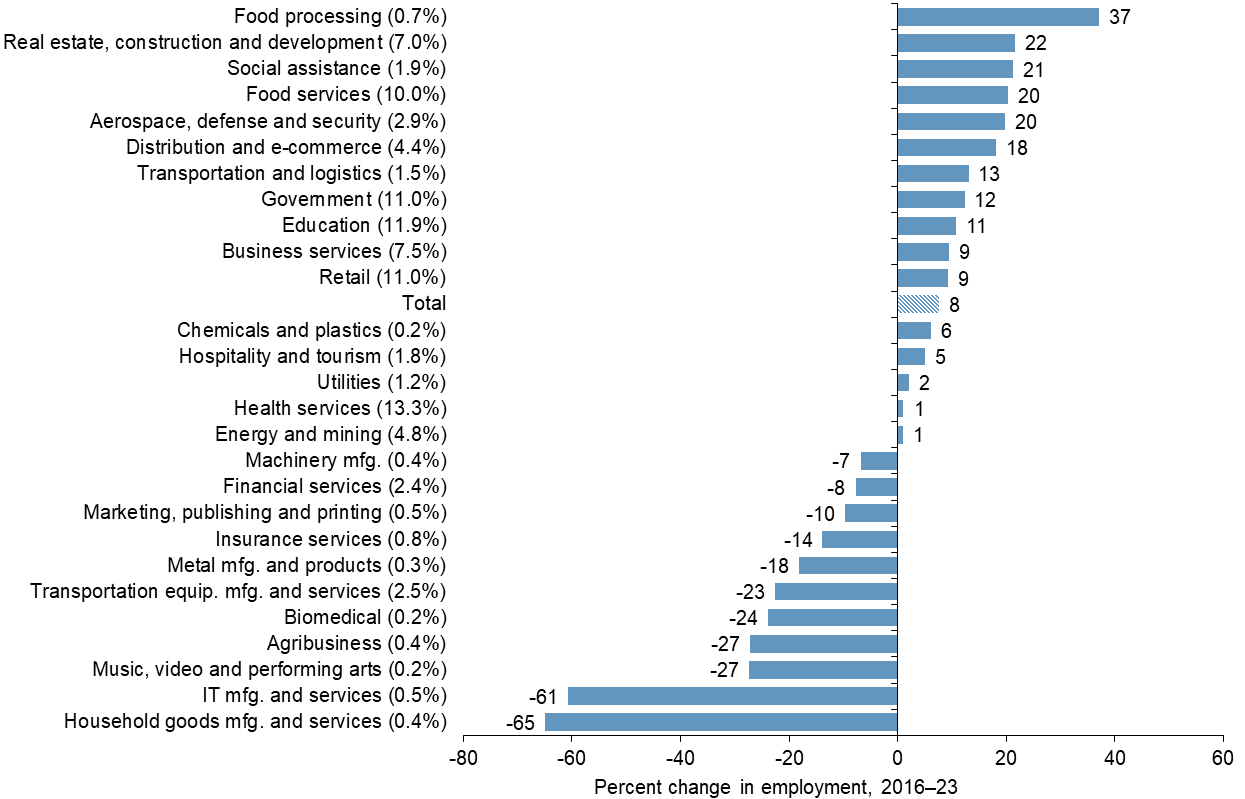
NOTES: Percent change in employment is shown in whole numbers. Each cluster’s share of total jobs is shown in parentheses (rounded to one decimal place). Clusters with employment shares less than 0.1 percent are not displayed.
SOURCES: Texas Workforce Commission; authors’ calculations.
Texas Tech has been a major driver of the local economy and population since its establishment in Lubbock in 1923. The university has more than 40,000 students and around 2,000 faculty members. There are around 55,000 college students across the metro, and about 10,000 graduate each year.[4]
Agriculture-related clusters such as food processing and agribusiness play an important role in the metro. Texas’ broader High Plains region, which includes Lubbock, harvests more than one-third of the annual U.S. cotton crop.[5]
Food processing, which comprises under 1 percent of employment, was the fastest growing cluster from 2016 through 2023. Growth was concentrated in some of the larger clusters—real estate, construction and development, food services, retail and government—while most clusters with large declines represent a smaller share of the workforce. Distribution and e-commerce and aerospace and defense also posted double-digit job gains during this period. A notable exception is health services, where employment levels were stable. Overall, Lubbock employment grew 8 percent from 2016 through 2023, below the state average of 16 percent.
Annual earnings in clusters with an LQ above 1 averaged $58,318 in 2023, only slightly higher than those with an LQ equal to or below 1, which averaged $54,522 (Table 12.1). This subset includes the food services and retail clusters, which depress the area’s average wages. Conversely, government and utilities helped boost average earnings. Energy and mining has experienced the biggest pay jump since 2016, increasing 23 percent to $82,929, followed by transportation equipment, which increased 21 percent to $62,271. Overall, in real (inflation-adjusted) terms, average annual earnings inched up 2.1 percent from 2016 through 2023.
| Cluster | Lubbock | U.S. | |||
| 2016 | 2019 | 2021 | 2023 | 2023 | |
| Government | 68,817 | 69,587 | 68,341 | 66,175 | 67,435 |
| Education | 59,792 | 60,719 | 60,599 | 56,710 | 66,490 |
| Food services | 20,025 | 20,457 | 20,626 | 20,320 | 25,821 |
| Utilities | 76,463 | 74,814 | 77,576 | 73,652 | 106,251 |
| Retail | 35,137 | 36,316 | 37,294 | 36,703 | 39,817 |
| Health services | 59,479 | 62,895 | 61,064 | 61,150 | 69,397 |
| Transportation equipment manufacturing and services | 51,523 | 52,207 | 54,880 | 62,271 | 66,929 |
| Energy and mining | 67,522 | 82,778 | 72,795 | 82,929 | 107,531 |
| Distribution and e-commerce | 64,781 | 68,501 | 66,436 | 64,950 | 83,656 |
| Clusters with location quotient > 1 | 57,463 | 57,472 | 56,647 | 58,318 | |
| Clusters with location quotient <= 1 | 51,925 | 56,264 | 53,937 | 54,522 | |
| Average earnings (total) | 50,750 | 53,128 | 52,197 | 51,818 | 70,033 |
| NOTES: Clusters are listed in order of location quotient (LQ); clusters shown are those with LQs greater than 1 in 2023. Earnings are in 2023 dollars. SOURCES: Texas Workforce Commission; Bureau of Labor Statistics; authors' calculations. |
|||||
Average earnings for workers—which take into account the number of people employed in each sector—were lower than the U.S. average in 2023.
Lubbock employment recovered fairly quickly from the pandemic. Lubbock lost more than 17,000 jobs from February through April 2020 amid pandemic-related closures, amounting to more than 10 percent of metro employment. However, by September 2021, jobs had rebounded to February 2020 levels, and as of December 2024, Lubbock employment was 7.4 percent above prepandemic levels, trailing Texas’ growth (9.7 percent) but outpacing the U.S. (4.4 percent).
There are signs of growth ahead. Lubbock food processing and agribusiness should get a big boost with the completion of Leprino Foods’ 850,000-square-foot dairy foods manufacturing facility. The $870-million project, announced in 2021, is expected to employ 600 workers when the two-phase construction is completed in 2026.[6]
Dura-Line, a fiber optics manufacturer and part of Mexico City-based Orbia, announced in 2023 a $52-million expansion with the addition of 141 jobs that will support expansion of broadband internet businesses.[7]
Demographics: Future professionals in training
Lubbock’s college student population partially explains the region’s wage, age and education trends. Real median household income fell from 2016 to 2023 as inflation outpaced earnings. Lubbock’s real median household income, $62,288, also trailed the state figure, $76,292.
Lubbock’s 15–24-year-olds made up 19.7 percent of the local population compared with that age group’s statewide figure of 14.1 percent in 2023. The collegestudent population likely explains Lubbock’s relatively young median age: 32.6 years compared with 35.9 years for the state.
Higher education should continue leading Lubbock in the future, especially as Texas Tech’s footprint continues to expand and support services grow. The readily available supply of educated workers should prove a boon for the area as more professional services jobs move to Texas, though Lubbock has struggled to retain its college graduates, who historically have left for more populous metros.
Lubbock and the Texas Tech University Health Sciences Center make up an established hub of health care across the region. The extensive medical sector should continue to serve West Texas more broadly, including rural areas struggling with health care access.
Notes
- The history of Lubbock has been adapted from the Texas State Historical Association’s Handbook of Texas.
- The percentage shares of individual clusters are normalized to add up to 100 and differ from individual industry share totals. Some industries are included in multiple clusters, while some others are omitted because they fall outside revised cluster definitions. (See the appendix for more information.)
- Information about Lubbock’s major employers and workforce is from the Lubbock Economic Development Alliance.
- Texas Tech University provides a brief institutional profile, and see note 3.
- “Telling the World About Our High Quality Cotton,” Cotton News, Plains Cotton Growers, Oct. 6, 2023.
- Data are from the Lubbock Economic Development Alliance.
- Data are from the Lubbock Economic Development Alliance.