Houston–Pasadena–The Woodlands: Texas’ Gulf Coast hub and nation’s energy capital
At a glance

Population (2023): |
7.5 million |
Population growth (2016–23): |
10.9 percent (Texas: 9.5 percent) |
Median household income (2023): |
$80,458 (Texas: $76,292) |
National MSA rank (2023): |
No. 5* |
| *The Houston–Pasadena–The Woodlands metropolitan statistical area (MSA) encompasses Austin, Brazoria, Chambers, Fort Bend, Galveston, Harris, Liberty, Montgomery, San Jacinto and Waller counties. | |
- Houston is Texas’ second-largest metro, accounting for one-quarter of the state’s jobs and 27 percent of its economic output.
- Houston began as a port city, rising to prominence as one of the nation’s busiest deepwater ports, ranking first in foreign waterborne tonnage.
- Due to its proximity to Spindletop, site of the legendary 1901 oil strike, the Houston area quickly became the energy capital of the U.S. and home to oil companies, refineries and petrochemical plants. The metro has diversified as the services, transportation and logistics, and biomedical industries have grown in importance.
- During the pandemic, unemployment rose in Houston, and the subsequent economic rebound lagged other metros in the state because of the energy sector’s protracted recovery.
History: An energy complex emerges from a port city
Houston was founded in 1836 along Buffalo Bayou, a waterway leading to the Gulf of Mexico. At the time, the city was dependent on agriculture and commerce, and most business involved selling supplies to area farmers.[1]
Because Buffalo Bayou was difficult to navigate, trade tended to pass through Galveston, 50 miles away on the coast. Rail lines connected Houston to the countryside, and by 1861, the city was the rail center of southeast Texas. The U.S. government began widening and deepening Buffalo Bayou in 1881. When the Houston Ship Channel was finally completed in 1914, Houston became a deepwater port, ranking among the top three ports by volume in the U.S. just before World War II.[2]
Drillers struck oil in 1901 at Spindletop, 75 miles to the east near Beaumont, catalyzing the oil boom in Texas. Sinclair Oil Co. built the first major oil refinery in Houston in 1918, and many others followed, constructing facilities along the Houston Ship Channel.
Forty oil companies had Houston offices by 1929. During World War II, demand for petrochemical products skyrocketed, and Houston quickly developed one of the largest petrochemical plant concentrations in the U.S. Houston was an international energy capital by the 1970s, expanding with the oil boom but also contracting during the 1980s bust.
Industry clusters: Energy and related industries dominate
Chart 6.1 shows the composition of industry clusters in Houston, organized by location quotient (LQ), a measure of a cluster’s share of local employment relative to its share nationally. Each cluster is plotted based on employment share change from 2016 through 2023.[3]
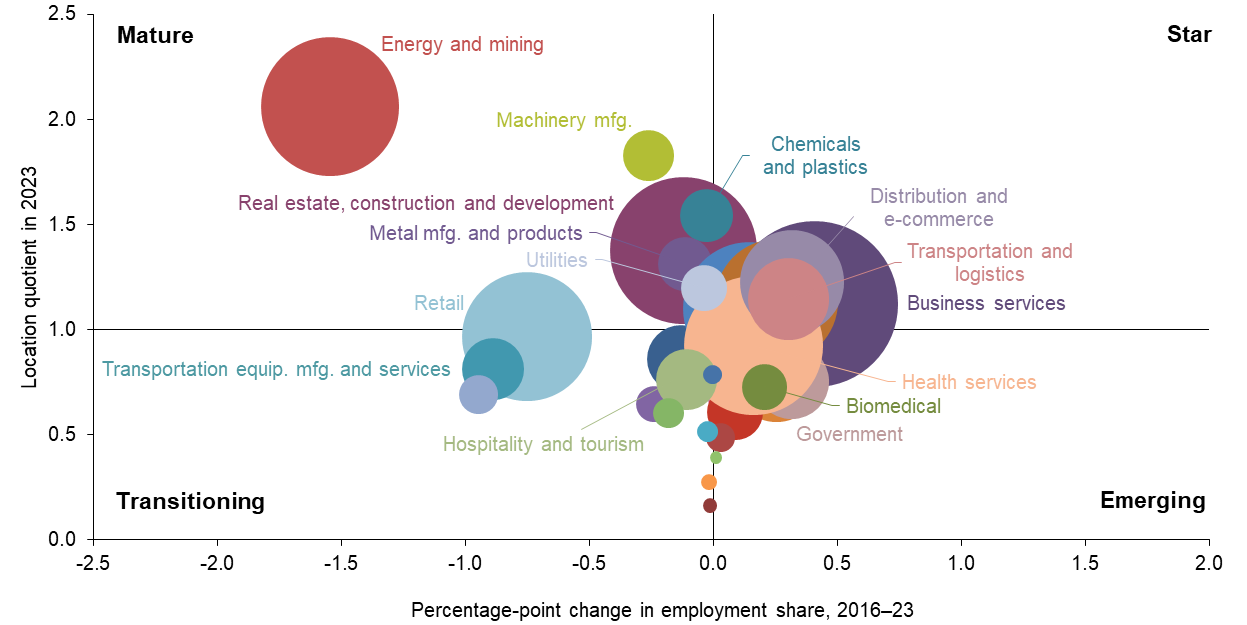
NOTE: Bubble size represents cluster share of metropolitan statistical area employment.
SOURCES: Texas Workforce Commission; Bureau of Labor Statistics.
Clusters in the “star” quadrant, such as business services, have a large share of employment relative to the nation (LQ exceeding 1) and are relatively fast growing; “emerging” clusters, such as biomedical, are smaller relative to the nation (LQ less than 1) but also fast growing. “Mature” clusters, such as energy and mining, are more concentrated but slower growing or contracting; “transitioning” clusters, such as hospitality and tourism, are smaller relative to the nation and slower growing.
The energy and mining cluster, which includes oilfield services and refining, has been overtaken by business services to make up the largest portion of Houston’s employment. In 2023, the energy and mining cluster accounted for 9.4 percent of Houston’s employment—a decline from the cluster’s share prior to the pandemic recession and related energy downturn.
From 2016 through 2023, energy and mining employment fell 2 percent (Chart 6.2). A bankruptcy cycle that began with the 2015–16 oil bust had not fully concluded before the pandemic damped global oil demand. Still, the cluster remains far more dominant in Houston relative to the nation due to the presence of many global energy firms.
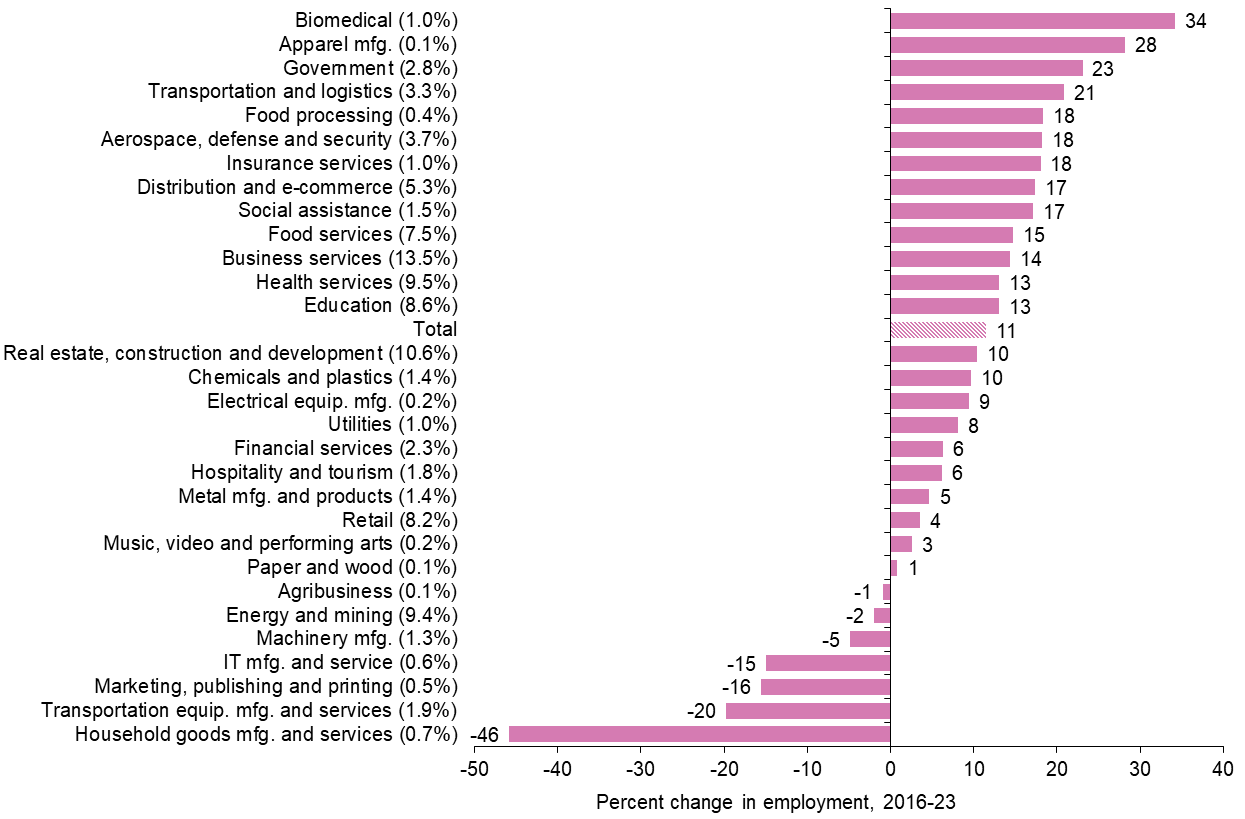
NOTES: Percent change in employment is shown in whole numbers. Each cluster’s normalized share of total jobs is shown in parentheses (rounded to one decimal place). Clusters with employment shares less than 0.1 percent are not displayed.
SOURCES: Texas Workforce Commission; authors’ calculations.
As of 2025, a total of 26 Fortune 500 companies had their headquarters in the Houston metro. Nineteen are energy related, including Exxon Mobil Corp., Phillips 66 and ConocoPhillips. Energy companies remain some of the largest individual employers in the metro area, with Exxon Mobil, Chevron Corp. and Shell USA employing 13,000, 7,000 and 9,000 workers.[4]
Chevron announced plans in 2024 to relocate its headquarters to Houston from San Ramon, California. The energy sector continues to undergo extensive merger and acquisition activity in the postpandemic period.
Along with exploration and production companies, oilfield services and pipeline firms add further weight to Houston’s energy and mining cluster. Baker Hughes employs 7,000 people in Houston, while Halliburton has 7,500 workers and Kinder Morgan 3,000. All three firms are headquartered in Houston metro area.
The concentration of fossil fuel companies in the metro supports a strong petrochemical manufacturing industry. More than 90 percent of the nation’s production capacity for basic petrochemicals is in Texas and Louisiana, the significant majority of which is in Texas, according to the American Chemistry Council.[5] The concentration of energy, chemical and transportation entities creates a unique dynamic in Houston; an economic downturn in one sector might aid an expansion in another. Relatively lower energy prices are a source of pain for extraction companies but often benefit manufacturing and export-related businesses, for example.
Despite the large role of energy in the local economy, diversification is ongoing. Business services grew 14 percent from 2016 through 2023 to become Houston’s largest cluster by employment. It now accounts for 13.5 percent of local employment. Several large business services firms are counted among Houston’s top employers, including Deloitte with 2,500 employees. Hewlett Packard Enterprise, which provides IT services and consulting, moved from California to suburban Spring in 2022 and had 2,800 employees at the start of 2025.
Real estate, construction and development is Houston’s second-largest cluster by employment. Houston’s real estate market is historically tied to the energy sector. The boom-and-bust nature of the energy sector means the local real estate market can be vulnerable to the same cycles, which became more pronounced during the oil bust in 2015-16 and the pandemic, when work-from-home arrangements contributed to declining office occupancy.
Houston is a major hub for transportation and logistics, which accounts for 3.3 percent of local employment. Though a smaller source of employment, the sector’s growth of 21 percent from 2016 through 2023 is among the fastest in the metro. United Airlines’ hub at George Bush Intercontinental Airport supports 11,000 employees. In March 2025, the airline announced it would break ground on a new ground service equipment maintenance facility and open a technical operations center.[6] Southwest Airlines, with more than 5,000 local workers, is the dominant carrier at William P. Hobby Airport.[7]
The Port of Houston is the nation’s largest port by foreign tonnage, handling 12 percent of all U.S. waterborne tonnage.[8] The port is a key gateway for fossil fuels and chemicals exports and cargo activity at the port’s terminals supports an estimated 30,000 jobs, according to a study commissioned by the Port of Houston Authority.[9]
The health services cluster, which includes the widely recognized Texas Medical Center, employs 9.5 percent of Houston’s workforce and grew 13 percent from 2016 through 2023. The separate biomedical cluster was the metro’s fastest growing cluster, expanding 34 percent from 2016 through 2023. Several of the area’s largest employers, with 20,000 or more workers each, are Memorial Hermann Health System, Houston Methodist and the University of Texas MD Anderson Cancer Center—the largest cancer hospital in the nation.
The major industry clusters in Houston pay significantly higher wages than other industries (Table 6.1). Average annual earnings for energy and mining, for example, were $141,667 in 2023; overall average earnings in Houston were $77,182.
| Cluster | Houston–Pasadena–The Woodlands | U.S. | ||||
| 2016 | 2019 | 2021 | 2023 | 2023 | ||
| Energy and mining | 148,895 | 144,902 | 132,806 | 141,667 | 107,531 | |
| Machinery manufacturing | 119,037 | 112,870 | 100,650 | 107,655 | 80,744 | |
| Chemicals and plastics | 133,798 | 140,080 | 130,259 | 135,919 | 88,828 | |
| Real estate, construction and development | 92,344 | 92,730 | 88,276 | 87,410 | 75,369 | |
| Metal manufacturing and products | 78,181 | 80,054 | 76,089 | 79,264 | 71,037 | |
| Distribution and e-commerce | 95,975 | 96,121 | 91,712 | 93,254 | 83,656 | |
| Utilities | 116,452 | 121,592 | 120,152 | 125,974 | 106,251 | |
| Transportation and logistics | 81,564 | 81,177 | 75,626 | 78,591 | 65,167 | |
| Food services | 23,545 | 24,177 | 24,930 | 25,000 | 25,821 | |
| Business services | 98,090 | 101,396 | 98,200 | 99,151 | 91,443 | |
| Education | 62,173 | 63,573 | 64,163 | 62,777 | 66,490 | |
| Clusters with location quotient > 1 | 95,459 | 96,243 | 91,169 | 94,242 | – | |
| Clusters with location quotient <= 1 | 70,825 | 71,860 | 72,260 | 72,121 | – | |
| Average earnings (total) | 78,833 | 79,397 | 77,126 | 77,182 | 70,033 | |
| NOTES: Clusters are listed in order of location quotient (LQ); clusters shown are those with LQs greater than 1 in 2023. Earnings are in 2023 dollars. SOURCES: Texas Workforce Commission; Bureau of Labor Statistics; authors’ calculations. |
||||||
Workers employed in the most concentrated clusters (those with LQs exceeding 1) earn on average 20 percent more than workers in less-concentrated clusters ($94,242 versus $72,121). Despite comparatively strong earnings relative to the nation, average real earnings declined 2.1 percent from 2016 through 2023. The shift was largely compositional, with low-paying sectors growing faster than high-paying sectors.
Demographics: Houston population more diverse
The demographics of Houston—the state’s second-most-populous metro, with 7.5 million residents—are more diverse than Texas’ other major metros. The Hispanic population of Houston, 38.3 percent, exceeds the white non-Hispanic population, around 32.4 percent. The Black (non-Hispanic) share, 17.3 percent, and Asian (non-Hispanic) share, 8.4 percent, are higher than in most other Texas metros in this report.

SOURCE: Census Bureau, 2023 American Community Survey one-year estimates.
Houston has historically been a gateway city for arriving immigrants. Nearly a quarter (24.8 percent) of residents are foreign born. Among the foreign-born population in 2023, 30.1 percent were from Latin America (excluding Mexico) and 25.8 percent were from Asia. During the recent immigration surge, Houston experienced large influxes of immigrants from Venezuela among other countries. A strong labor market, global companies, an established immigrant community and universities enhance Houston’s attractiveness.
Houston trails Dallas and Austin in the share of the population with a bachelor’s degree or higher. This reflects the abundance of energy and manufacturing jobs, which often pay well but do not require a college degree. However, Houston’s population is more educated than Texas overall; 36 percent of Houston’s population holds a bachelor’s degree or higher, compared with the state average of 34.2 percent.
Employment: Pandemic impacts workforce
The pandemic brought the global economy to a virtual standstill in spring 2020. Houston employment dropped 11.3 percent from February to April 2020, in line with other large metros and the state. Unemployment in Houston peaked at 13.8 percent in April 2020, exceeding the 12.8 percent statewide peak the same month.
Additionally, Houston’s postpandemic job growth has trailed other large metros and the state. Energy, construction and manufacturing have been the slowest to regain prepandemic employment levels, while trade, transportation and utilities, financial services and professional services were the fastest.
The pandemic significantly strained the city’s medical system. Houston’s Black and Hispanic populations were hardest hit, as was the area’s recent immigrant population. Working in front-line service jobs during the onset of the pandemic and subsequent quarantine meant higher exposure to the virus. Less access to health care also entailed more adverse health outcomes than other groups.
Outlook: Diversification underway, climate risk looms
Houston’s global leadership in the energy sector and in the manufacturing and trade that it supports remains a key driver of the local economy. These sectors are pillars of strength in normal times but expose the region to industry-specific shocks because while diversification is progressing, it is incomplete.
Shifting trade policy and higher tariffs could have an outsized impact on Houston given the Port of Houston’s role as one of the nation’s busiest gateways for energy, chemicals and manufactured goods. Container traffic, while robust, has fluctuated in response to changing trade policy.[10]
Climate risk is also increasing. The Gulf Coast, including Houston, is experiencing more frequent and more severe storms, hurricanes and flooding that cause widespread damage and bring economic activity to a virtual standstill. Following repeated catastrophic flood insurance claims—notably, from Hurricane Harvey in August 2017—Harris County began an extensive buyout program for property located in floodplains. Insurance rates have subsequently risen, affecting housing affordability. Some insurers have become more selective in issuing policies or have left the market.
Long-term projections show continued growth in global demand for oil and natural gas through 2050.[11] However, with domestic fossil fuel energy consumption expected to decline by then, U.S. production will increasingly depend on exports to overseas markets. New port facilities are being developed to meet the growing international demand for liquefied natural gas and other gas liquids.
The region also likely has a role to play in the evolving world of decarbonization. Houston was selected to be the largest of seven hydrogen hubs in the nation.[12] Additionally, Houston is a leading candidate for carbon sequestration—pumping carbon emissions from industrial processes deep underground where it can be stored long-term instead of emitting the greenhouse gas into the atmosphere.
Cutting-edge scientific exploration plays off the area’s longstanding strengths. The Lyndon B. Johnson Space Center, the nexus for manned space exploration, will likely get new attention as the nation aims to resume lunar exploration with longer-term ambitions of going to Mars in the 2030s. Houston’s biomedical cluster, similarly, is expected to be a driver of growth. The presence of major hospital systems as well as local research universities and business growth initiatives attract biomedical and biotechnology firms and entrepreneurs.
Further diversification into services, health, biomedical and renewables while maintaining a strong footing in the traditional energy sector will grow Houston’s economy and mitigate the risks of the boom-and-bust cycle of energy markets.
| Houston–Pasadena–The Woodlands growth outlook |
|
Drivers
Challenges
|
Notes
- The history of Houston is adapted from the Texas State Historical Association’s (TSHA) Handbook of Texas.
- “The History and Significance of the Houston Ship Channel,” by Marilyn M. Sibley, Handbook of Texas, TSHA.
- The percentage shares of individual clusters are normalized to add up to 100 and differ from individual industry share totals. Some industries are included in multiple clusters, while some others are omitted because they fall outside revised cluster definitions. (See the appendix for more information.)
- Data on Fortune 500 companies in Houston come from the Greater Houston Partnership. Top employers data are sourced from Harris County and the Houston Chronicle.
- Information on chemical production capacity comes from the American Chemistry Council.
- “United Airlines Breaks Ground on New $177M Ground Service Equipment Facility and Opens New State-of-the-Art Technical Operations Training Facility at George Bush Intercontinental Airport,” March 25, 2025.
- “Houston Airports, Southwest Airlines celebrate expansion of Hobby Airport.”
- “Houston Ship Channel Ranked #1 U.S. Waterway,” Port of Houston press release, May 5, 2025.
- “2022 Economic Impact of Houston Ship Channel Activity,” Martin Associates prepared for the Port of Houston Authority, May 2023.
- Port data are from the Port of Houston.
- “ExxonMobil Global Outlook: Our view to 2050.”
- “DOE Selects Gulf Coast as Regional Clean Hydrogen Hub,” Greater Houston Partnership, Oct. 13, 2023.