Beaumont–Port Arthur: The Golden Triangle shines as petrochemicals boom
At a glance

Population (2023): |
395,479 |
Population growth (2016–23): |
-3.5 percent (Texas: 9.5 percent) |
Median household income (2023): |
$65,245 (Texas: $76,292) |
National MSA rank (2023): |
No. 140* |
| *The Beaumont–Port Arthur metropolitan statistical area (MSA) encompasses Hardin, Jefferson and Orange counties. | |
- The Spindletop oil discovery near Beaumont in 1901 transformed the small lumber and port town into a thriving oil and gas hub, with one of the nation’s largest concentrations of refineries, petrochemical plants and related businesses.
- The area, which includes the city of Orange, became known as the Golden Triangle, a reference to the wealth that resulted from Spindletop’s oil riches.
- Population has declined modestly since peaking in 2017, likely due to lackluster job growth from 2015 through 2021—a result of natural disasters and the pandemic, as well as the winding down of several massive, labor-intensive construction projects.
History: Discovery of oil transforms the area
While Beaumont, like many Texas communities, traces its initial growth to the post-Civil War arrival of the railroad, it owes its longer-term viability to the Spindletop oil gusher in 1901. The oil field south of town spawned three oil companies, the Texas Co. (later Texaco), Gulf Oil Corp. and Humble (later Exxon Mobil), and established the region as an oil distribution and refining hub. Beaumont, part of Texas’ Golden Triangle along with Port Arthur and Orange, saw its population double during Spindletop’s first decade. Discovery of another oil field at Spindletop in 1925 again brought a burst of growth to the area.[1]
Nearby Port Arthur, which founder Arthur E. Stilwell initially envisioned as a tourist destination (naming the town after himself), became a seaport following the creation of a canal linking Sabine Lake to Sabine Pass in 1899. The canal was deepened and extended up the Neches River to Beaumont and Orange in 1908. Refineries tied to Spindletop followed, and by 1909, Port Arthur was already the nation’s 12th-largest port based on the value of exports. By 1914, it had become the second-largest oil-refining center in the country.
Industry clusters: A global petrochemical and industrial complex
Location quotients (LQs), which compare the relative concentration of industry clusters locally and nationally, are a convenient way of assessing key drivers in an economy. Industry cluster growth is measured by the percentage-point change in its share of local employment between 2016 and 2023 (Chart 11.1).[2]
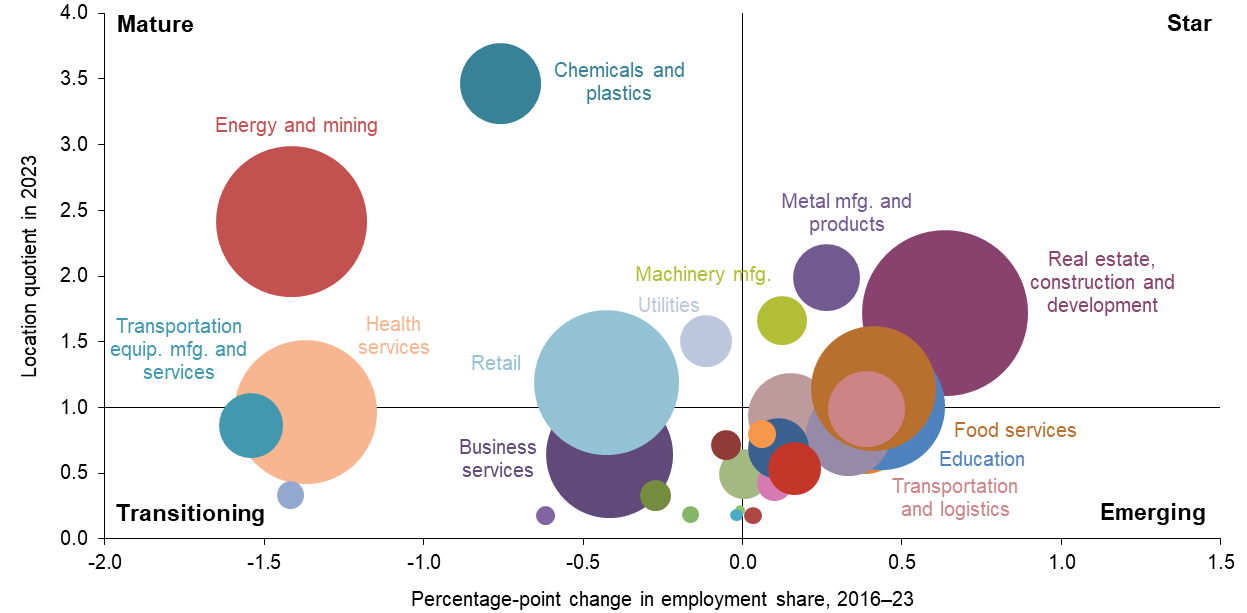
NOTE: Bubble size represents cluster share of metropolitan statistical area employment.
SOURCES: Texas Workforce Commission; Bureau of Labor Statistics.
Clusters in the top half of Chart 11.1, such as chemicals and plastics manufacturing, real estate, construction and development, and energy and mining, have a larger share of employment relative to the nation and, thus, an LQ greater than 1. These clusters are generally vital to the area’s economy and can expand relatively rapidly (“star”) or grow relatively slowly (“mature”). Those in the bottom half are less dominant locally than nationally and, hence, have an LQ less than 1. “Emerging” clusters are fast growing; those growing slowly or declining are “transitioning.”
Energy and mining-related companies, including both upstream and downstream firms, make up the second-largest cluster in Beaumont–Port Arthur, employing 11.2 percent of the workforce. The sector is more than twice as concentrated in Beaumont–Port Arthur than in the U.S. Major employers include Exxon Mobil in Beaumont (2,000 workers) and Motiva Enterprises and Valero in Port Arthur (1,500 and 770, respectively).[3] The Motiva facility, owned by Aramco, processes more than 720,000 barrels of oil per day, making it the largest refinery in North America.
Similarly, the chemical industry is a major cluster. Chemical and plastics manufacturing boasts 3.5 times the concentration in Beaumont–Port Arthur than in the U.S. due to the significant presence of employers such as BASF Corp. and Total Petrochemicals and Refining USA, which together operate the world’s largest steam cracker. The facility refines crude oil and natural gas into basic chemicals used to make many consumer and industrial goods.
Texas-based chemical companies have benefited from the past decade’s shale boom that produced cheap and plentiful supplies of natural gas and related liquids (such as ethane and propane), which are feedstock for ethylene, propylene and myriad other petrochemicals. Historically low natural gas prices gave the industry a competitive edge versus foreign producers that rely on oil-based products as inputs and propelled a dramatic rise in new construction and expansion projects for plants along the Gulf Coast. The projects include BASF’s $270 million expansion of its dicamba herbicide production facility in Beaumont, completed in 2017.[4]
With the 2015–16 shale oil bust, many chemical and refinery-related expansions were put on hold. As prices recovered, some companies renewed prior expansion plans. TotalEnergies and Borealis began operating a $2 billion ethane cracker in 2022 in Port Arthur.[5] The facility will serve a $1.4 billion polyethylene plant expansion in nearby Pasadena (in the Houston metro area) that began in October 2023. The close location of two such facilities is an example of the integrated chemical and refining operations common in the region.
The Beaumont–Port Arthur economy has reflected the turbulence within the energy sector, which experienced an oil price collapse in 2014–15, late 2018 and again during the initial part of the pandemic in 2020. Other clusters, including food processing, insurance, and transportation and logistics, experienced the greatest relative payroll growth from 2016–23, though they all are comparatively small parts of the area economy (Chart 11.2). Overall, employment fell during the period. Some clusters, such as retail and business services, appear to have not bounced back following the pandemic. The slow recovery in employment within the energy and mining and chemicals and plastics clusters reflects both increased mechanization in industrial facilities and the overlapping effects of the 2015–16 oil bust and the 2020–21 pandemic.
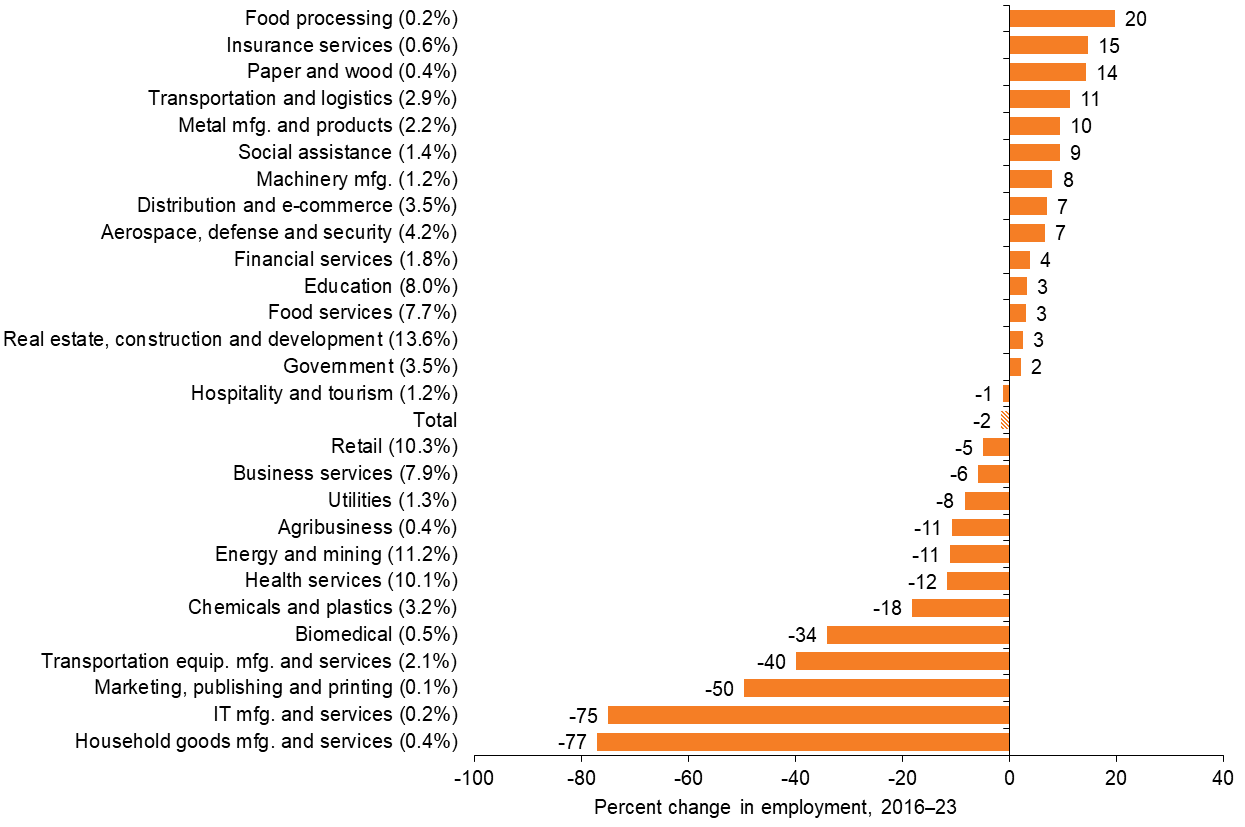
NOTES: Percent change in employment is shown in whole numbers. Each cluster’s share of total jobs is shown in parentheses (rounded to one decimal place). Clusters with employment shares less than 0.1 percent ate not displayed.
SOURCES: Texas Workforce Commission; authors’ calculations.
The region remains an important seaport, with both the ports of Beaumont and Port Arthur among the top 25 U.S. water ports for total tonnage in 2024.[6] The majority of the tonnage moving through both ports is crude petroleum and its refined products (gasoline, diesel and fuel oil). In October 2022, the Port of Beaumont received a $26.4 million federal Port Infrastructure Development Program grant to partially fund two projects increasing outdoor storage capacity, alleviating capacity constraints and supporting future development.[7] Subsequently, in mid-2024, the Port of Beaumont received $23.9 million and Port Arthur $19.6 million in state grants for infrastructure and connectivity projects.[8]
Real average earnings have been relatively flat since 2016 (Table 11.1). Wages in industries with an LQ greater than 1 have boosted the area’s earnings, and in 2023, workers in these clusters (star and mature) made $75,000 annually on average, compared with $62,000 on average across all clusters.
| Cluster | Beaumont–Port Arthur | U.S. | ||||
| 2016 | 2019 | 2021 | 2023 | 2023 | ||
| Chemicals and plastics | 150,694 | 154,943 | 147,029 | 138,710 | 88,828 | |
| Energy and mining | 121,770 | 113,689 | 106,552 | 113,551 | 107,531 | |
| Metal manufacturing and products | 76,964 | 78,248 | 75,976 | 76,614 | 71,037 | |
| Real estate, construction and development | 84,640 | 82,963 | 76,057 | 80,380 | 75,369 | |
| Machinery manufacturing | 86,101 | 82,148 | 82,786 | 80,119 | 80,744 | |
| Utilities | 102,019 | 105,181 | 82,531 | 83,590 | 106,251 | |
| Retail | 37,255 | 37,797 | 38,368 | 36,800 | 39,817 | |
| Food services | 20,624 | 20,341 | 20,560 | 21,277 | 25,821 | |
| Education | 47,484 | 47,019 | 46,985 | 44,909 | 66,490 | |
| Clusters with location quotient > 1 | 78,374 | 80,649 | 71,221 | 75,105 | - | |
| Clusters with location quotient <= 1 | 59,610 | 60,871 | 61,135 | 59,879 | - | Average earnings (total) | 65,515 | 65,270 | 62,031 | 62,266 | 70,033 |
| NOTES: Clusters are listed in order of location quotient (LQ); clusters shown are those with LQs greater than 1 in 2023. Earnings are in 2023 dollars. SOURCES: Texas Workforce Commission; Bureau of Labor Statistics; authors' calculations. |
||||||
Demographics: Household income increases
The shale boom fueled job growth in Beaumont–Port Arthur, driven by an increase in petrochemical construction. Since then, job growth receded with the departure of some residents following devastating periodic flooding, including from Hurricane Harvey (2017) and Hurricane Isabel (2023), along with the impact of the pandemic.
As a result, the area only slowly regained employment, taking until January 2024 to achieve job levels of January 2020. Some departing personnel were likely drawn to opportunities in the more diversified economy of Houston, 75 miles west. As petrochemical facility-related construction winds down, labor demand has softened and thousands of construction workers have moved on. The completed facilities still employ many residents but not as many as their construction required.
The metro area’s median household income of $65,245 trails the state median, likely due to a less-educated, trade-heavy workforce than in the state as a whole. Nevertheless, the median household income has increased nearly 40 percent since 2016, when it was $47,170. About 19 percent of residents ages 25 and older have at least a bachelor’s degree, a lower share than among most of the Texas metros covered in this report and 15 percentage points lower than the Texas average of 34 percent in 2023. Many petrochemical and manufacturing-related jobs do not require college degrees.
Beaumont–Port Arthur’s significance as a key player in the petrochemical industry will continue to dominate its fortunes in the medium to long term.
Notes
- The histories of Beaumont and Port Arthur are adapted from the Texas State Historical Association’s Handbook of Texas.
- The percentage shares of individual clusters are normalized to add up to 100, as some industries are counted in multiple clusters, and some industries are not counted at all based on cluster definitions and differ from individual industry shares. (See the appendix for more information.)
- Employment data are from the individual company websites: Exxon Mobil’s Beaumont facilities, Motiva Enterprises’ refinery and Valero’s Port Arthur refinery.
- See “BASF Expands Production Capacity for Herbicide Dicamba in Beaumont, Texas,” BASF news release, March 21, 2017.
- Data are from TotalEnergies website.
- Port data are from the Bureau of Transportation Statistics.
- Information is from Port of Beaumont.
- Information is from Port of Beaumont.