Overview: Texas and its metros
Texas, with four metropolitan areas of at least 2.5 million residents, has more big cities per capita than most large U.S. states. Dallas–Fort Worth and Houston rank among the top seven largest metropolitan areas in the U.S. in terms of both population and economic output. In fact, Texas is the only state with two metros in the top 10 for both measures.
Texas’ large cities provide an important growth advantage in addition to the state’s other favorable economic factors. Those include a central location; ample oil and gas deposits; well-trafficked ports by land, sea and air; proximity to Mexico; a rapidly growing population and workforce; a relatively low cost of living; and a relatively light regulatory burden. It is no surprise that both employment and output typically grow faster in Texas than in the nation, and the recovery following the pandemic was no different.[1]
This third edition of At the Heart of Texas, a special report on the historical, economic and demographic profiles of Texas and its key metropolitan areas, builds upon the first two editions released in February 2016 and December 2018. It also advances the time period under study, focusing on economic developments within Texas and its metros from 2016 through 2023. This period includes the pandemic recession and subsequent recovery, as well as the current artificial-intelligence-led boom that is propelling rapid data center expansion and billions in investment across the state.
Importance of cities
It is the age of the city. Paradoxically, as globalization put everything and everywhere seemingly within reach, attention has shifted from national boundaries to these smaller units of civilization. This is not new when taking a longer perspective; after all, cities have been the rock stars of history before, whether it’s Babylon, the cradle of civilization; Athens, the birthplace of democracy; Florence, the origin of the Renaissance; or Birmingham, home of the Industrial Revolution.
Cities were centers of population, commerce, learning, wealth and economic opportunity long before economists explained why agglomeration matters to growth.
Cities are dense areas with relatively high productivity and wages compared with noncities. The productivity advantage stems from agglomeration, which means firms that co-locate have ready access to a deep labor pool, easy exchange of ideas, supply chains and low transportation costs.[2] When firms in like industries cluster, they can further leverage the benefits of agglomeration. Examples are Silicon Valley, de facto headquarters of the U.S. high-tech industry, and Houston, home to the bulk of the nation’s oil and gas sector. Harvard economist Ed Glaeser calls cities “mankind’s greatest invention” and argues in a 2011 book that cities have led human progress through the ages by acting as engines of innovation.[3]
Dominant clusters power Texas
Characteristics such as location, natural resources and labor force contribute to an area’s long-run economic performance. Industry mix and industry agglomeration are additional important factors. Geographically, groups of firms are concentrated based on the technologies they employ, the markets they serve, the goods and services they produce and the labor skills they require. Such industry clusters are important because they provide their participants (firms) access to specialized knowledge and resources, enhancing productivity, spurring innovation and attracting new business and investment to the area.[4]
An area typically has an economic base that consists of several dominant industry clusters. These clusters typically exceed the national average in their share of employment, output and earnings. Location quotients (LQs), which compare the relative concentration of industry clusters locally and nationally, are one way of assessing these key drivers in an area’s economy. An LQ exceeding 1 indicates that a specific industry cluster is more dominant locally than nationally. In this report, LQs are calculated using industry cluster employment, and industry cluster growth is measured by the percentage-point change in its share of local employment from 2016 through 2023.[5]
The presentation here uses annual employment data from the Quarterly Census of Employment and Wages to compute location quotients. These data are readily available at the metropolitan statistical area (MSA) level and by three-digit-or-higher North American Industry Classification System (NAICS) code, facilitating the analysis. Industry cluster definitions are taken from the Cluster Mapping Project at the Harvard Business School, with modifications detailed in the appendix. Clusters generally comprise multiple interdependent or interrelated industries or NAICS classifications. The music, video and performing arts cluster in Los Angeles and the transportation equipment, manufacturing and services cluster in Detroit are examples of such broad groupings that include the main industry and its suppliers and service providers.
Chart 1.1 plots industry cluster LQs and their growth for Texas. Clusters in the top half of the chart, such as energy and mining, education, information technology, business services, financial services, and distribution and e-commerce, are referred to as base clusters. They have a larger share of state employment relative to the nation and, thus, an LQ exceeding 1. A base cluster is usually vital to an area’s economy and can be expanding relatively rapidly (star) or growing slowly or declining (mature).
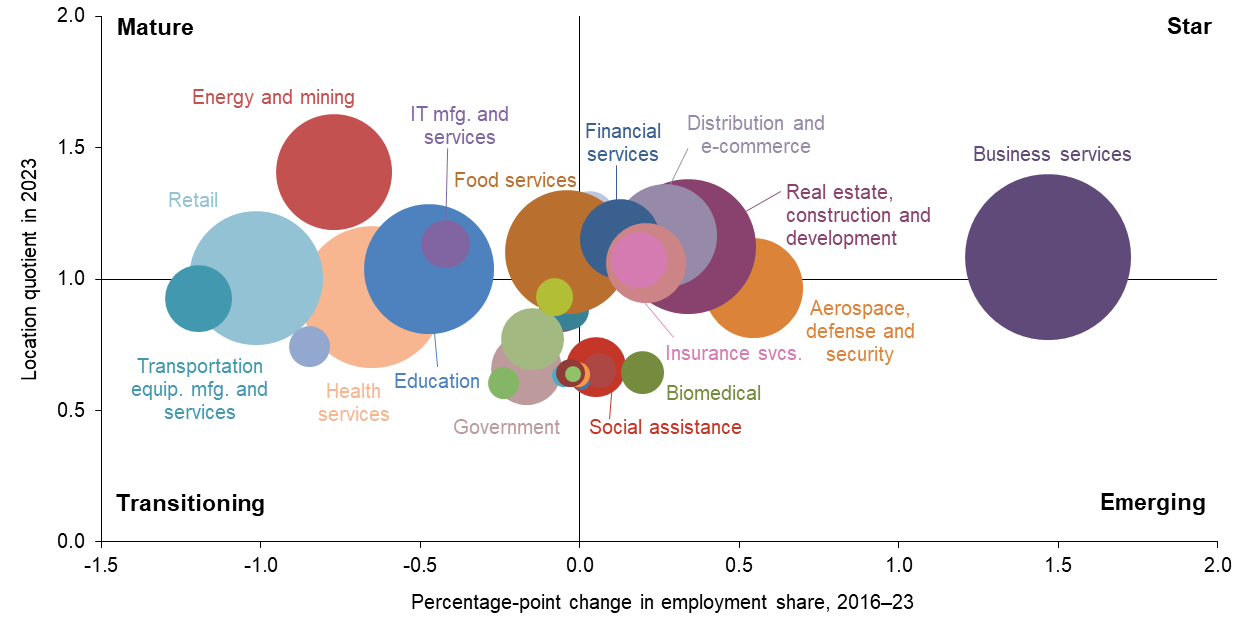
NOTE: Bubble size represents cluster share of Texas employment.
SOURCES: Texas Workforce Commission; Bureau of Labor Statistics.
Clusters in the bottom half of the chart are less dominant locally than nationally. They generally produce services or goods for local consumption and, hence, have an LQ below 1. “Emerging” clusters, such as social assistance and biomedical, are relatively fast growing, while those growing slowly or declining are termed “transitioning.”
The aerospace, defense and security, education, health services, social assistance and utilities clusters combine public- and private-sector employment. Thus, apart from the government cluster and these mixed sectors, all others are comprised of only private sector employment.
Texas’ leading clusters
Texas has several dominant clusters. An abundance of oil and gas has traditionally made energy-related industries a major cluster—the energy and mining cluster employs 6.7 percent of the state’s workforce and has an LQ of 1.4. Texas’ geological makeup includes four shale formations—the Permian Basin, Barnett, Haynesville and Eagle Ford—helping make the state the No. 1 producer of oil and gas in the nation. Texas produces nearly half of all U.S. crude oil and over a quarter of U.S. natural gas.[6] While the state’s oil and gas output rose to record highs in the 2016 through 2023 period, the employment share of the cluster declined (Chart 1.1), as the period was marked by industry consolidation, technological advances and productivity gains—all changes that limited headcount gains (Chart 1.2).
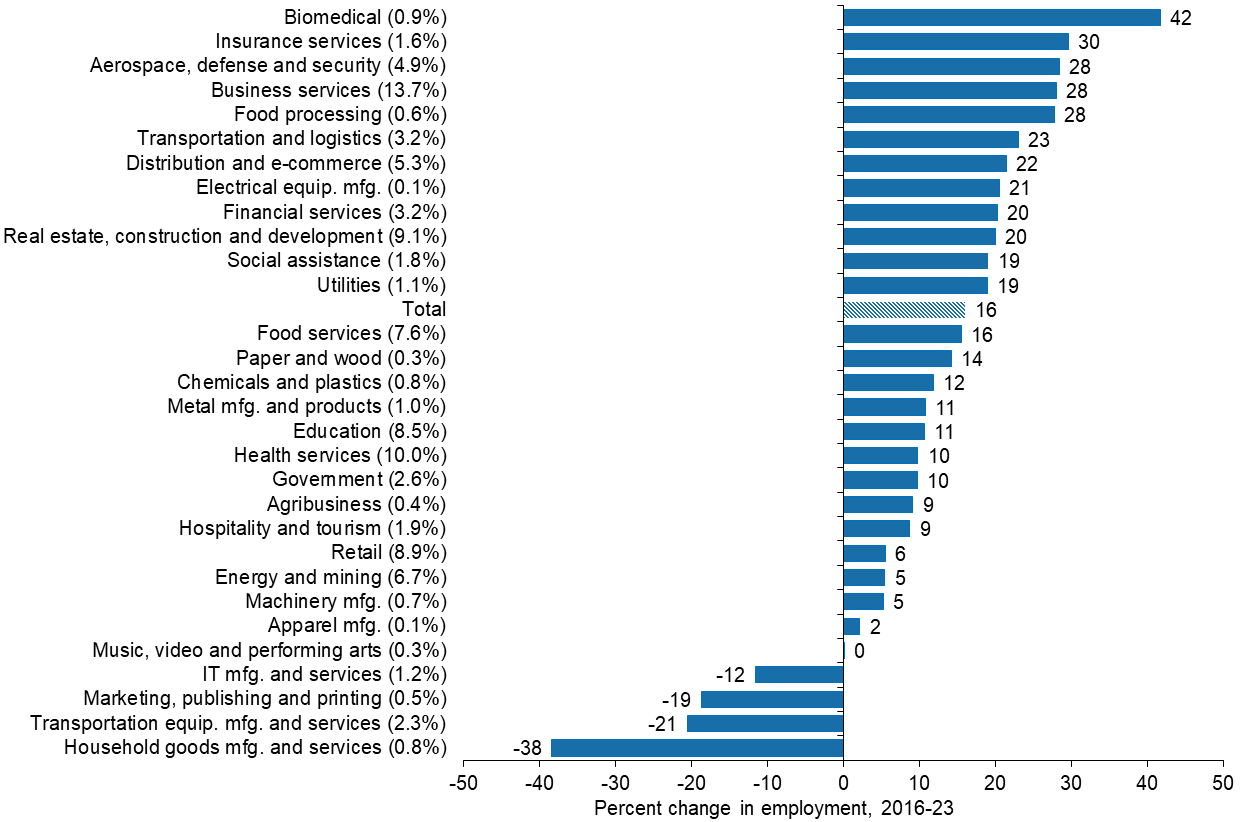
NOTES: Percent change in employment is shown in whole numbers. Each cluster’s normalized share of total jobs is shown in parentheses (rounded to one decimal place). Clusters with employment shares less than 0.1 percent are not displayed.
SOURCES: Texas Workforce Commission; authors’ calculations.
The state’s growth, geography and abundant natural resources have propelled it to the forefront of both non-renewable and renewable energy production. In addition to oil and natural gas, Texas produces more wind energy than any other state and leads the nation in utility-grade solar electricity generation.[7] The downstream energy sector also plays a meaningful role in Texas, which isn’t surprising given the significant presence of refineries and petrochemical plants along the Gulf Coast. Texas is home to one-third of the nation’s refining capacity and 75 percent of its petrochemical manufacturing capacity.
Texas also leads the nation in electricity consumption and generation, and that is not expected to change any time soon. Texas’ power consumption is projected to accelerate faster than any other state in coming years.[8] Population growth, the electrification of the economy and proliferation of large-scale computing facilities—notably data centers—will markedly increase demand on the state’s electric grid.[9]
Employment in the real estate, construction and development cluster (LQ of 1.1 in 2023) grew 20 percent over the period, supported by overall strong economic performance that increased demand for residential and industrial space.
Texas has evolved into a major high-tech hub, with an LQ of 1.1 for IT manufacturing and services in 2023. The industry took off after World War II, as Dallas-based Texas Instruments and other military electronics manufacturers branched into civil electronics. Texas also flourished during the 1990s high-tech boom, when the IT and telecommunications industries expanded in Austin and Dallas. Employment in the IT manufacturing and services cluster contracted 12 percent from 2016 through 2023. By comparison, business services and aerospace, defense and security—with complementary ties to the state’s high-tech and energy sectors—rapidly expanded, rising 28 percent during the period.
Texas’ central U.S. location and its border with Mexico have boosted the concentration of the transportation and logistics cluster as well as the distribution and e-commerce cluster. Texas is the largest exporting state in the nation, and it is home to two large commercial airlines, a major railroad and two of the nation’s busiest ports—Houston, a seaport, and Laredo, the nation’s second-largest port by value of shipments, trailing only the Port of Los Angeles as of 2024.[10] Education, which includes elementary and secondary schools, also has a slightly higher-than-average presence in the state, likely due to a younger population than the nation.
Several of Texas’ dominant clusters, such as energy and mining, IT manufacturing and services, business services, insurance services and financial services, boast high pay (Table 1.1). In fact, the average pay of workers in several clusters with an LQ greater than 1 exceeds the comparable U.S. figure. Earnings in dominant clusters are also 19 percent higher than the overall average for the state ($69,991).
| Cluster | Texas | U.S. | |||
| 2016 | 2019 | 2021 | 2023 | 2023 | |
| Energy and mining | 112,856 | 113,169 | 105,502 | 114,486 | 107,531 |
| Utilities | 104,427 | 108,257 | 105,258 | 106,725 | 106,251 |
| Distribution and e-commerce | 89,183 | 91,982 | 90,624 | 91,097 | 83,656 |
| Financial services | 94,833 | 101,911 | 107,950 | 105,795 | 120,489 |
| IT manufacturing and services | 127,054 | 136,295 | 137,973 | 129,622 | 131,681 |
| Real estate, construction and development | 78,160 | 80,554 | 78,896 | 79,434 | 75,369 |
| Food services | 22,350 | 23,160 | 24,174 | 24,346 | 25,821 |
| Business services | 83,846 | 88,171 | 91,847 | 92,101 | 91,443 |
| Insurance services | 92,809 | 95,541 | 94,487 | 92,211 | 101,445 |
| Transportation and logistics | 68,332 | 70,195 | 67,846 | 69,911 | 65,167 |
| Education | 55,715 | 56,675 | 58,196 | 56,789 | 66,490 |
| Retail | 38,024 | 39,301 | 42,902 | 40,495 | 39,817 |
| Clusters with location quotient > 1 | 74,773 | 84,375 | 78,880 | 83,584 | |
| Clusters with location quotient <= 1 | 70,877 | 68,762 | 72,610 | 69,271 | |
| Average earnings (total) | 66,901 | 69,090 | 70,216 | 69,991 | 70,033 |
| NOTES: Clusters are listed in order of location quotient (LQ); clusters shown are those with LQs greater than 1 in 2023. Earnings are in 2023 dollars. SOURCES: Texas Workforce Commission; Bureau of Labor Statistics; authors’ calculations. |
|||||
The Texas earnings premium in dominant industry clusters is consistent with what theoretically ought to occur. Productivity should be higher in dominant industries, reflecting demand for workers’ specialized skill sets. Thus, employers pay an earnings premium over the same industry cluster in locations where the cluster is not dominant. While the data for the state mostly bear this out, it isn’t always the case for the metros. Industry earnings at the metro level reflect myriad local considerations that distort comparisons with the nation, including cost of living, workforce demographics and skill levels.
Popular migrant destination
Migration has played an important role in sustaining the state’s long-term economic growth premium. Nearly half of workers in the state are not native Texans. Pull factors include plentiful job opportunities, a welcoming business environment and a relatively low cost of living. From 2000 through 2019, population gains were fairly evenly split between net migration (domestic and international) and natural increase (births minus deaths) (Chart 1.3). From 2020–24, however, migration accounted for a dominant share of the state’s population growth.[11]
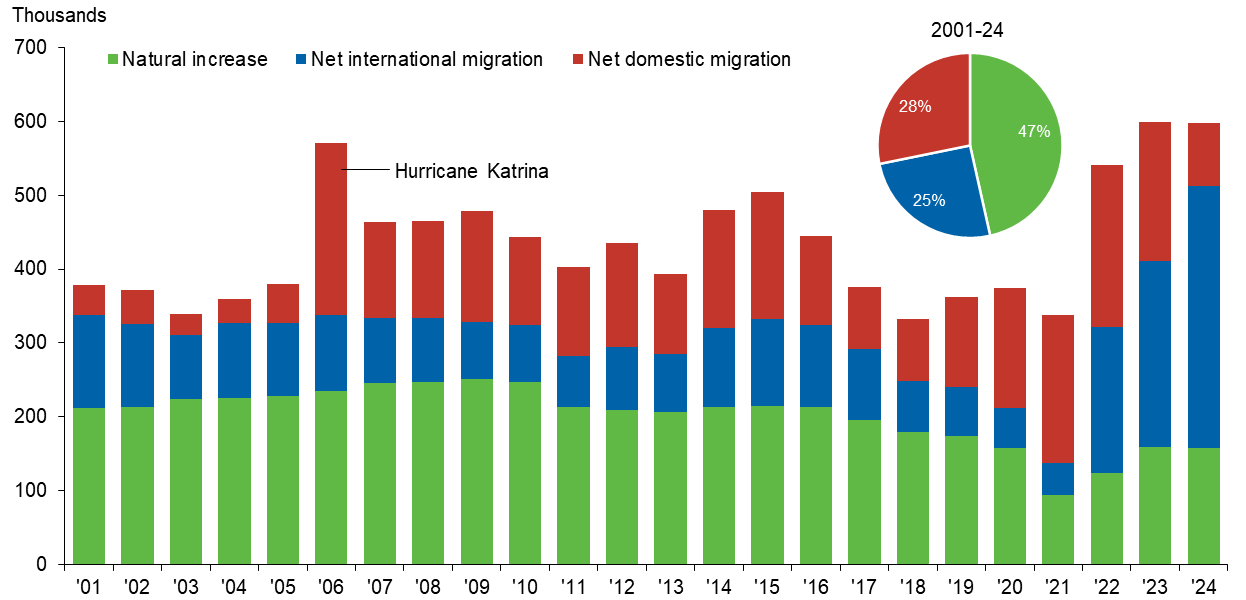
NOTE: Census Bureau estimates approximate the population on July 1 of the year indicated, and thus, capture changes from the previous year.
SOURCE: Census Bureau.
Texas bounced back quickly from the pandemic, attracting many workers and firms, in part due to fewer COVID-19 restrictions and some pent-up demand that the transition to remote work unleashed. Texas was the second-largest net recipient of domestic migrants (after Florida) among the 50 states from April 2020 to July 2024, taking in 748,000 people—2.6 percent of the state’s 2020 population.
Domestic migrants to Texas came from a variety of states, with transplants from California accounting for the largest share during the period. Arrivals from other countries—part of a record surge of humanitarian migration—also contributed strongly to the state’s population growth, with immigrants from Latin America making up the largest share of inflows. Texas was the recipient of 821,000 net international migrants from 2020 to 2024, amounting to 2.8 percent of its 2020 population.[12]
The migrant inflow propelled the state’s population growth rate during the study period to more than
double that of the U.S. Texas is younger and has a larger share of foreign-born residents relative to the rest of the nation.
Magnet for corporate moves
Texas is a leading destination for corporate headquarters that are on the move, partly due to its fast-growing labor force and accommodative business climate. As a result, Texas is home to 54 Fortune 500 companies.[13] Overall, 314 companies relocated their corporate headquarters to Texas from 2015 through 2024, with most choosing the Dallas-Plano-Irving and Austin-Round Rock-San Marcos metro areas (Chart 1.4).[14] Although corporate relocations slowed after the 2021 peak, they remain in line with the state’s historical average.
Chart 1.4: Corporate moves to Texas peak during pandemic, led by Austin and Dallas
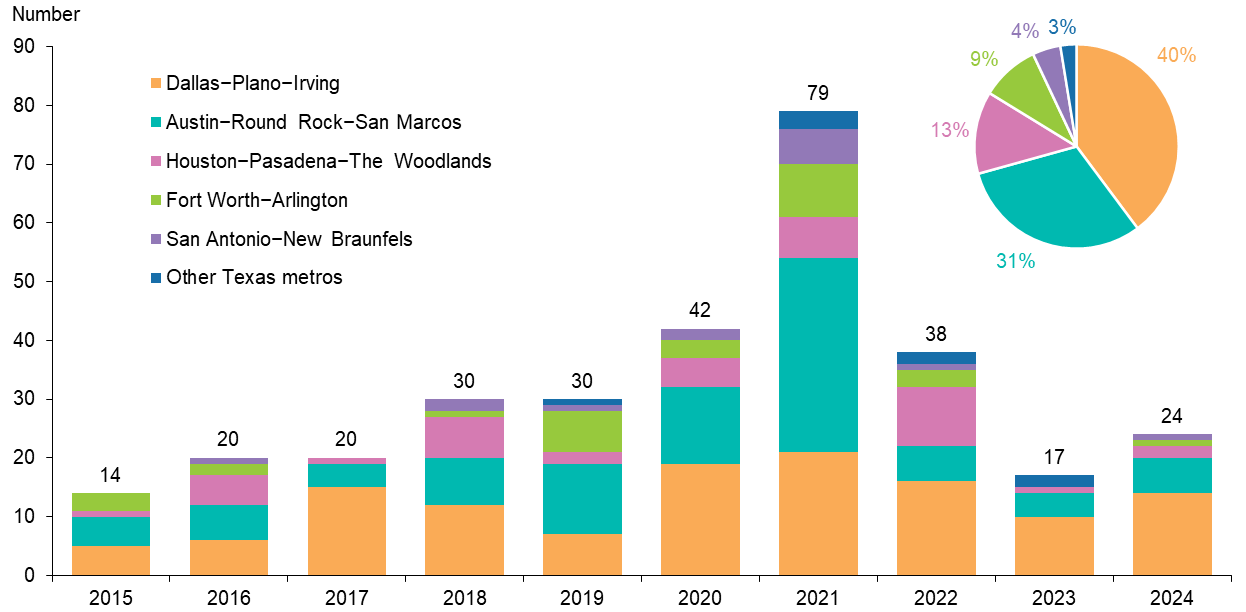
NOTE: Corporate headquarter relocations shown by arrival destination.
SOURCES: Texas Economic Development and Tourism Office; authors’ calculations.
Texas outperforms nation, but headwinds abound
Recent history, on the whole, has been good for Texas and its metros despite the pandemic. From December 2016 through December 2023, Texas grew significantly faster than the nation, with state job gains averaging 2.1 percent per year, compared with 1.2 percent for the nation. Texas output growth also outpaced the U.S. during the period.
The pandemic threw the global economy into crisis. Texas employment declined 11 percent from February to April 2020, and the nation experienced a 14 percent drop. However, Texas returned to prepandemic employment levels in October 2021, nine months before the nation. The Texas expansion continued into 2025, albeit at a steadily slowing pace that has resulted in below-trend job growth for two consecutive years.
A number of new headwinds, and some tailwinds, cloud the state’s outlook. Tariffs increased markedly in 2025, and nearly half of Texas firms face higher input costs as a result.[15] Texas firms also rely disproportionately on immigrant workers, and stricter immigration policy and lower immigration have made hiring and retention of both high- and low-skilled foreign-born workers more difficult.[16]
Meanwhile, deregulation momentum and federal tax law changes that were passed in mid-2025 will likely benefit Texas businesses, while cloud computing and the AI boom attract record investment in data center construction and electricity generation. New and existing liquefied natural gas projects continue to attract investment along the Gulf Coast.
New to the third edition
This edition revises cluster definitions for improved clarity and updates the economic analysis. The cluster definitions are those developed by the Cluster Mapping Project at the Harvard Business School.[17]
Modifications to the cluster methodology, used to determine key industrial sectors within metros, are explained in the appendix. Among the changes, the government sector covers only employment within local, state and federal governments and excludes public employment in health care, education, social assistance, utilities, and aerospace and defense clusters.
Having surveyed the state, we now turn to its metropolitan areas. Industry clusters of each area define a metro’s distinctive place in the state’s economy and explain how it contributes to job growth and income gains statewide.
Notes
- Texas job growth (real GDP) averaged 1.7 (3.5) percent per year, compared with 0.8 (2.2) percent for the nation during 2000–24. Texas job growth (real GDP) averaged 3.6 (5.7) percent per year, compared with 2.8 (3.6) percent for the nation during 2021–24.
- “The Wealth of Cities: Agglomeration Economies and Spatial Equilibrium in the United States,” by Edward L. Glaeser and Joshua D. Gottlieb, National Bureau of Economic Research, NBER Working Paper no. 14806, March 2009.
- Triumph of the City: How Our Greatest Invention Makes Us Richer, Smarter, Greener, Healthier, and Happier, by Edward L. Glaeser, New York: Penguin Press, 2011.
- For more information on what clusters are and how they affect competition and innovation, see “Location, Competition and Economic Development: Local clusters in a Global Economy,” by Michael E. Porter, Economic Development Quarterly, vol. 14, February 2000, pp. 15–34. Also, see “Clusters, Convergence, and Economic Performance,” by Mercedes Delgado, Michael Porter and Scott Stern, National Bureau of Economic Research, NBER Working Paper no. 18250, July 2012.
- The percentage shares of individual clusters are normalized to add up to 100 and differ from individual industry share totals. Some industries are included in multiple clusters, while some others are omitted because they fall outside revised cluster definitions. (See the appendix for more information.)
- Data about Texas oil and natural gas production are from the U.S. Energy Information Administration.
- Information on Texas energy production and consumption can be found at the U.S. Energy Information Administration.
- See note 7.
- “Data Centers Are Booming in Texas. What Does That Mean for the Grid?”, U.S. News and World Report, Jan. 24, 2025, and “AI Data Centers, Desperate for Electricity, Are Building Their Own Power Plants,” Wall Street Journal, Oct. 15, 2025.
- “Top U.S. Foreign Trade Freight Gateways by Value of Shipments,” U.S. Department of Transportation, Bureau of Transportation Statistics, 2024.
- “Largest Texas metros lure big-city, coastal migrants during pandemic,” by Wenli Li and Yichen Su, Federal Reserve Bank of Dallas, Southwest Economy, fourth quarter, 2021.
- Data are from the Census Bureau.
- Detail on the Fortune 500 companies in Texas from the Office of the Texas Governor, accessed Nov. 17, 2025.
- Data on corporate headquarter relocations to Texas were compiled by the Texas Economic Development and Tourism Office. The listing and synopsis were accessed Nov. 17, 2025.
- The Dallas Fed’s Texas Business Outlook Surveys asked respondents about the impact of tariffs in August 2025.
- The Dallas Fed’s Texas Business Outlook Surveys queried firms about the impact of new immigration policies in July 2025.
- See U.S. Cluster Mapping Project, Institute for Strategy and Competitiveness, Harvard Business School, accessed Nov. 18, 2025.