At the heart of Texas: Cities’ industry clusters drive growth
Austin–Round Rock: government and high tech at the state’s center
- Print version
- Additional tables: Austin location quotients, employment shares, average annual earnings, demographics
At a glance

Population (2017): |
2.1 million |
Population growth (2010–17): |
22.5 percent (Texas: 12.1 percent) |
Median household income (2017): |
$73,800 (Texas: $59,206) |
National MSA rank (2017): |
No. 31* |
Kauffman Startup Activity Index rank (2017): |
No. 2* |
| *The Austin–Round Rock metropolitan statistical area (MSA) encompasses Bastrop, Caldwell, Hays, Travis and Williamson counties. The Kauffman Startup Activity Index, a measure of business creation in the 40 largest U.S. metropolitan areas, is further explained in the appendix. | |
- Austin’s political and educational influence arose from its position as the state capital and home to the University of Texas.
- Today, the region is a major high-tech hub for both the state and the U.S. and home to numerous large and small technology companies.
- Fueling Austin’s rapid economic expansion is its young and well-educated workforce.
- Austin’s employment growth appears little affected by the slowdown in the state economy attributable to low oil prices, and the area will likely experience continued solid growth in the near term.
History: a government, education and technology hub
Austin was established in 1839 as the capital of the Republic of Texas. The city became the westernmost railroad station along the Houston and Texas Central Railway in 1871, and with no other railroad towns for miles in most directions, it became a trading center.[1]
Austin’s status as Texas’ political center remained uncertain until 1872, when the city was chosen as the permanent capital in a statewide referendum. In 1881, it was selected as the site for the new University of Texas.
Oil-boom growth in the early 20th century largely bypassed Austin, and the city fell from its fourth-place population ranking in Texas in 1880 to 10th place in 1920. Completion of two dams in the early 1940s greatly aided the area’s subsequent growth.
Expansion of Austin’s key education and government sectors supported the region in the 1950s and 1960s. Buoyed by chamber of commerce efforts to expand the economic base and by a flourishing research program at UT, major technology firms such as IBM, Texas Instruments and Motorola began locating in the area in the late 1960s and early 1970s. Austin gradually emerged as a high-tech center. Of the 108 largest employers in the area in 2016, 56 were high-tech firms.[2]
Industry clusters: hotbed for high tech
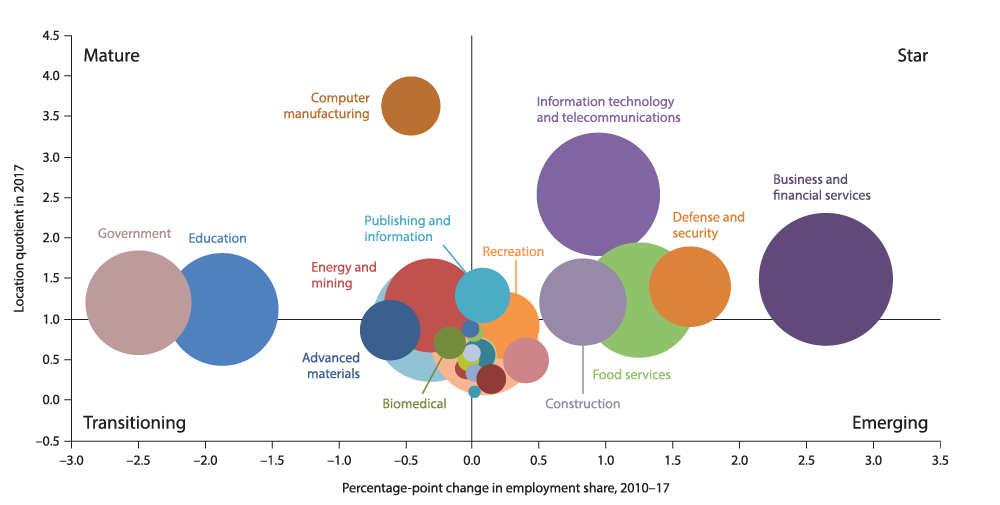
Cluster concentration is measured by location quotients (LQs), which compare the metro-area and U.S. economies. Growth in a cluster is measured by the percentage-point change in its employment share between 2010 and 2017.[3]
Chart 2.1 displays the composition of industry clusters in Austin–Round Rock. The top two quadrants—“mature” and “star”—display industry clusters with a larger share of employment relative to the nation (LQs exceeding 1). These clusters are vital to the metro-area economy and can be expanding relatively rapidly (star) or growing relatively slowly (mature). Clusters shown in the bottom two quadrants—such as advanced materials and biomedical—are smaller relative to the nation (LQs below 1). These less-concentrated clusters are labeled either “emerging” if they are fast growing or “transitioning” if they are slow growing.

NOTE: Bubble size represents cluster share of metropolitan statistical area employment.
SOURCES: Texas Workforce Commission; Bureau of Labor Statistics; authors’ calculations.
The underpinnings of Austin’s economy are government, education and the technology industry. Computer manufacturing boasts nearly four times the concentration in Austin than in the U.S., reflecting the significant presence of manufacturers of personal computers and related goods and services such as Dell, Apple, Advanced Micro Devices and Applied Materials.
Dell, with 13,000 local workers, and Apple and IBM, each with 6,000 employees, are among the area’s largest employers.[4] Additionally, a sizable footprint from numerous hardware, software, computing and systems design companies—including tech giants Samsung, Intel and Hewlett-Packard—make the concentration of Austin’s information technology and telecommunications cluster 2.5 times that of the nation.[5]
As the state capital and home to the flagship UT campus—a highly regarded research institution—Austin’s government and education sectors are large. Both the federal and state governments and the university are top area employers.
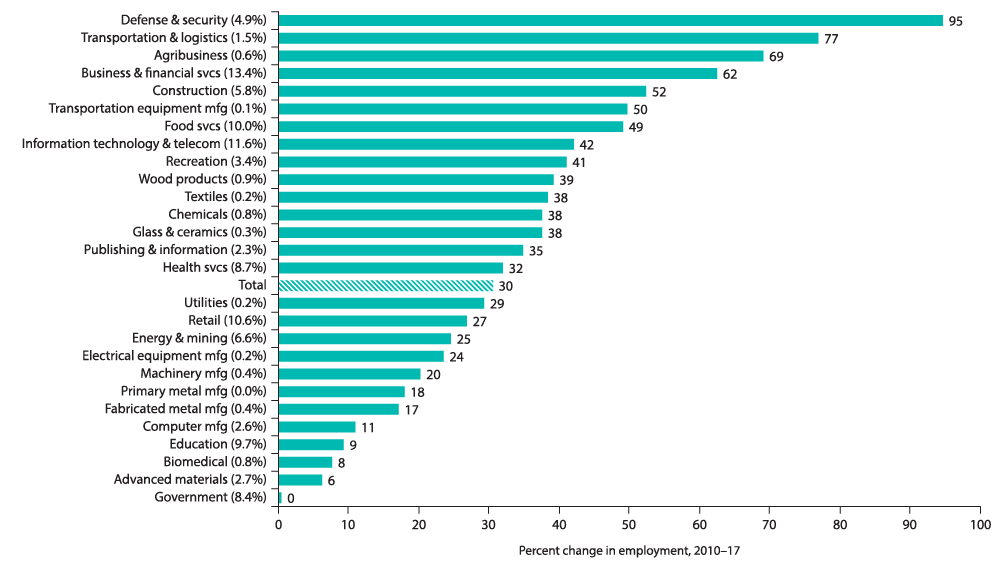
Other concentrated clusters include publishing and information, defense and security, energy and mining, and business and financial services. The defense and security sector nearly doubled in size from 2010 to 2017, making it the fastest-growing cluster in terms of job growth and complementing both UT and the significant technology presence in the region (Chart 2.2). The transportation and logistics, agribusiness, and business and financial services sectors take the following three spots among rapidly growing clusters.

NOTES: Percent change in employment is shown in whole numbers. Each cluster's share of jobs is shown in parentheses (rounded to one decimal place).
SOURCES: Texas Workforce Commission; authors’ calculations.
Food services is important to the local economy, and along with recreation services, this cluster highlights the tourist draws of such events as Austin City Limits and South by Southwest (SXSW). An Austin slogan, “Live Music Capital of the World,” is a nod to the numerous live music venues.
The health cluster, which employs 8.7 percent of Austin’s workforce, has also grown significantly in recent years. The second- and third-largest private employers in the city are the Seton Healthcare Family, with 10,270 employees, and St. David’s HealthCare, with nearly 8,600 employees. The summer 2017 opening of the Dell Seton Medical Center, a significant component of the new Dell Medical School at UT, has also expanded opportunities for health care workers in the area. Though the concentration of health industry employment remains below that of the U.S. (LQ is 0.73), cluster employment has increased 32 percent since 2010.
Austin’s star and mature clusters pay considerably higher wages than their less-concentrated counterparts (Table 2.1). Computer manufacturing, information technology and telecommunications, and business and financial services boast some of the region’s best-paying jobs. In fact, the average earnings within computer manufacturing were around $141,000 in Austin in 2017, more than double the metro’s average of about $59,700 across all sectors. Overall, Austin residents employed in the base clusters (those with LQs greater than 1) earn 46 percent more on average—$78,600 versus $53,900—than those employed in less-concentrated clusters.
Moreover, wages in three of Austin’s top four most-concentrated clusters—computer manufacturing (LQ of 3.6), information technology (LQ of 2.5) and defense and security (LQ of 1.4)—were significantly higher than the national average for those clusters in 2017.
| Cluster | Austin | U.S. | |||||
| 2010 | 2012 | 2014 | 2016 | 2017 | 2017 | ||
| Computer manufacturing | 134,849 | 134,613 | 127,210 | 137,120 | 141,034 | 120,226 | |
| Information technology and telecommunications | 110,531 | 110,169 | 104,068 | 110,332 | 115,479 | 106,629 | |
| Business and financial services | 90,174 | 90,887 | 91,559 | 97,649 | 99,067 | 100,785 | |
| Defense and security | 86,112 | 88,731 | 93,620 | 105,400 | 107,064 | 91,226 | |
| Publishing and information | 81,350 | 79,867 | 83,672 | 82,886 | 87,536 | 96,127 | |
| Food services | 18,277 | 18,724 | 19,164 | 20,393 | 20,847 | 18,963 | |
| Construction | 52,051 | 52,445 | 55,686 | 59,481 | 60,828 | 60,742 | |
| Government | 57,686 | 57,398 | 60,279 | 62,491 | 62,749 | 60,568 | |
| Energy and mining | 88,610 | 90,357 | 87,958 | 91,692 | 93,701 | 80,900 | |
| Education | 45,912 | 42,576 | 44,937 | 46,272 | 46,589 | 49,322 | |
| Clusters with location quotient > 1 | 70,689 | 71,949 | 72,915 | 76,727 | 78,638 | – | |
| Clusters with location quotient < 1 | 53,813 | 51,373 | 51,900 | 54,111 | 53,946 | – | |
| Average earnings (total) | 55,013 | 55,501 | 56,118 | 58,497 | 59,742 | 55,375 | |
| NOTES: Clusters are listed in order of location quotient (LQ); clusters shown are those with LQs greater than 1. Earnings are in 2017 dollars. SOURCES: Texas Workforce Commission; Bureau of Labor Statistics; authors’ calculations. |
|||||||
Demographics: young, highly skilled talent pool
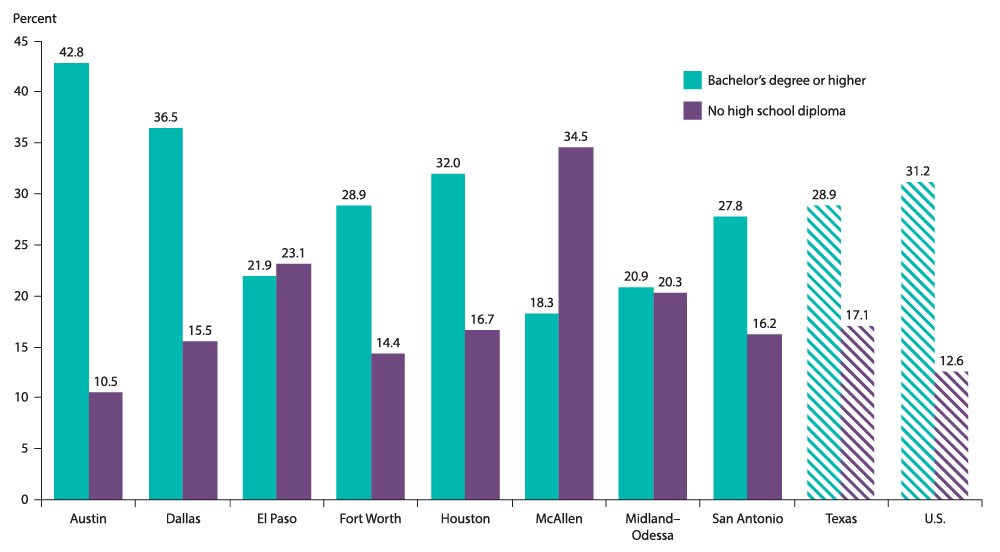
The Austin metro area’s strength is its young and well-educated workforce—its median age is 3.5 years below the U.S. median. The area ranks No. 1 in college education among the major Texas metros (Chart 2.3).

NOTE: Share of population age 25 and over.
SOURCE: Census Bureau, 2016 American Community Survey 1-year estimates.
Austin placed eighth on the list of the most-educated U.S. metros, according to a study by WalletHub.[6] Nearly 43 percent of adults (25 years and older) in the metro area have at least an undergraduate degree, compared with 28.9 percent in Texas and 31.2 percent nationally in 2016. This is one reason the metro area has attracted many high-tech companies and boasted a median household income of $73,800 in 2017, significantly higher than that of the state and nation.
Hispanics make up 32.2 percent of the area’s inhabitants, less than the share in Texas overall. Foreign-born residents constitute 14.4 percent of the metro population, lower than their share in Texas but slightly higher than the national average.
Employment: strong rebound, unrelenting growth
Employment declines in Austin during the Great Recession were steep. However, the area was the first major metro to bounce back, regaining all lost jobs 26 months after the beginning of the downturn. In December 2017, total nonfarm employment was 31 percent over its previous peak in September 2008.
Austin’s rapid postrecession expansion has benefited from its outsized concentration of high-tech jobs—both in information technology and telecommunications and in business and financial services. From December 2009 to December 2017, employment in professional, scientific and technical services increased 81 percent, and payrolls in information services grew 60 percent.[7]
Even as the Texas economy slowed through the 2015–16 oil bust, Austin’s job growth remained vigorous. Austin added to its payrolls at a 3.3 percent rate in 2016 and by 2.8 percent in 2017. Unemployment in Austin was more than a percentage point below the Texas rate in 2017; it dropped to a 17-year low of 2.7 percent in October 2017. The unemployment rate, which subsequently ticked up to 2.8 percent in October 2018, remains low, a testament to both the strength of Austin’s economy and the challenges that lie ahead for businesses in finding workers to fill positions. Austin is also a hotbed of entrepreneurial activity, ranking second among U.S. metro areas, according to the Kauffman Startup Activity Index in 2017.[8]
Outlook: No slowing in sight
Austin’s economy is dependent on the technology industry, with 6 percent of its 2016 gross domestic product generated from the information services sector. Global semiconductor sales, a barometer for the technology sector, are expected to grow strongly through 2018, according to World Semiconductor Trade Statistics.[9] This bodes well for the Greater Austin economy.
Still, the region remains unable to attract significant amounts of venture capital relative to other high-tech hubs such as San Francisco and Boston. Venture capital funding in 2017 declined 16 percent compared with 2016—from more than $900 million to just over $760 million. This compares with a 17 percent increase in national venture capital and a 56 percent funding increase—or $300 million—across the rest of Texas. While Austin remains attractive to startups and tech workers, small businesses looking for capital to expand may face challenges.
Some of the area’s technology jobs are tied to the energy industry. Examples are those in the production of high-tech instruments and computer equipment for hydraulic fracturing of shale formations. Employment in the area’s manufacturing industries declined in 2014 and 2015, in part due to depressed oil prices. However, with strengthening in energy activity in 2017, manufacturing employment rose 4.7 percent.
UT’s presence provides stability and growth to the education, biomedical and health sectors. The opening of the Dell Medical School at UT should further expand the capacity of medical research in the region.
The U.S. Army's recent announcement that its Futures Command will be headquartered in Austin will further boost the region's ties to the defense and security sector. Also, the area’s vibrant and educated workforce will likely continue to attract employers, providing new growth opportunities.
Both the commercial real estate and housing markets in the metro area are healthy, although there are some signs of softening. Conversely, strong home prices and rent appreciation over the past several years have continued to weaken home affordability for lower-wage workers. While this trend in prices is moderating, continued in-migration of high-wage earners will keep the pressure on living costs.
—Laila Assanie and Christopher Slijk
| Austin–Round Rock Growth Outlook | |
| Drivers | Challenges |
|
|
Notes
- The history of Austin has been adapted from the Texas State Historical Association’s Handbook of Texas, tshaonline.org/handbook/online/articles/hda03.
- Detail about the largest Austin metro-area employers is provided by the Austin Chamber of Commerce, www.austinchamber.com/economic-development/austin-profile/business-industry#Region's Largest Employers.
- The percentage shares of individual clusters do not add to 100 because some industries are counted in multiple clusters, and some industries are not counted at all based on cluster definitions. (See the appendix for more information.)
- See note 2.
- The information technology and telecommunications cluster includes firms categorized in North American Industry Classification System code 334, computer and electronic product manufacturers.
- Data are from the “Most and Least Educated Cities in America” list published by WalletHub. The study ranked the 150 largest U.S. metros based on 11 metrics, including the percentage of adult residents with a high school diploma, associate degree, bachelor’s degree and graduate or professional degree; quality of public schools and universities; and students per capita enrolled in the top universities in the U.S. See wallethub.com/edu/most-and-least-educated-cities/6656.
- Employment data are from the Texas Workforce Commission and are early benchmarked and are seasonally adjusted by the Federal Reserve Bank of Dallas.
- Data are from the 2017 Kauffman Startup Activity Index, which is based on three indicators: the rate of new entrepreneurs starting businesses, opportunity share (a measure of the percentage of new entrepreneurs not coming out of unemployment) and startup density.
- The “World Semiconductor Trade Statistics” August 2018 release projects that the worldwide semiconductor market will grow by 15.7 percent to $477 billion in 2018 following a 21.6 percent increase in 2017. See wsts.org/76/Recent-News-Release.