At the heart of Texas: Cities’ industry clusters drive growth
Dallas–Plano–Irving: Texas’ business and financial services hub
- Print version
- Additional tables: Dallas location quotients, employment shares, average annual earnings, demographics
At a glance

Population (2017): |
4.9 million |
Population growth (2010–17): |
15.6 percent (Texas: 12.1 percent) |
Median household income (2017): |
$68,734 (Texas: $59,206) |
National MSA rank (2017): |
No. 4* (Dallas and Fort Worth combined) |
Kauffman Startup Activity Index rank (2017): |
No. 11* (Dallas and Fort Worth combined) |
| *The Dallas–Plano–Irving metropolitan division is part of the Dallas–Fort Worth metropolitan statistical area (MSA) and encompasses Collin, Dallas, Denton, Ellis, Hunt, Kaufman and Rockwall counties. The population of the Dallas–Fort Worth MSA is 7.4 million. The Kauffman Startup Activity Index, a measure of business creation in the 40 largest U.S. metropolitan areas, is further explained in the appendix. | |
- Dallas’ prominence arose from its importance as a center for the oil and cotton industries and its location along numerous railroad lines.
- Today, Dallas serves as the business and financial services center for the state and has evolved into a major high-tech hub.
- Dallas has become a popular migrant destination, attracting residents from abroad as well as from other states.
- The metro’s finance, insurance and transportation sectors are expected to see continued expansion following an earlier national consolidation that increased the sectors’ local concentration.
History: Business center rises from rail crossroads
Dallas quickly became a service center for the surrounding countryside after its founding in 1841. By the 1870s, Dallas had attracted two major rail lines, making it one of the first rail crossroads in Texas and establishing the city as a strategic location for the transport of regional products to manufacturers to the north and east.[1]
Dallas became the world’s leading inland cotton market at the beginning of the 20th century. It also rapidly evolved into a center of petroleum financing; Dallas bankers were among the first in the nation to lend money to oil companies using oil reserves as collateral.
The growth of companies such as Texas Instruments Inc. helped make Dallas the nation’s third-largest technology center during the 1950s and '60s. The opening of Dallas/Fort Worth International Airport in 1974 provided a major selling point, bringing corporate headquarters to Dallas and further increasing the area’s prominence as the state’s business and financial center.
Industry clusters: Business and finance loom large
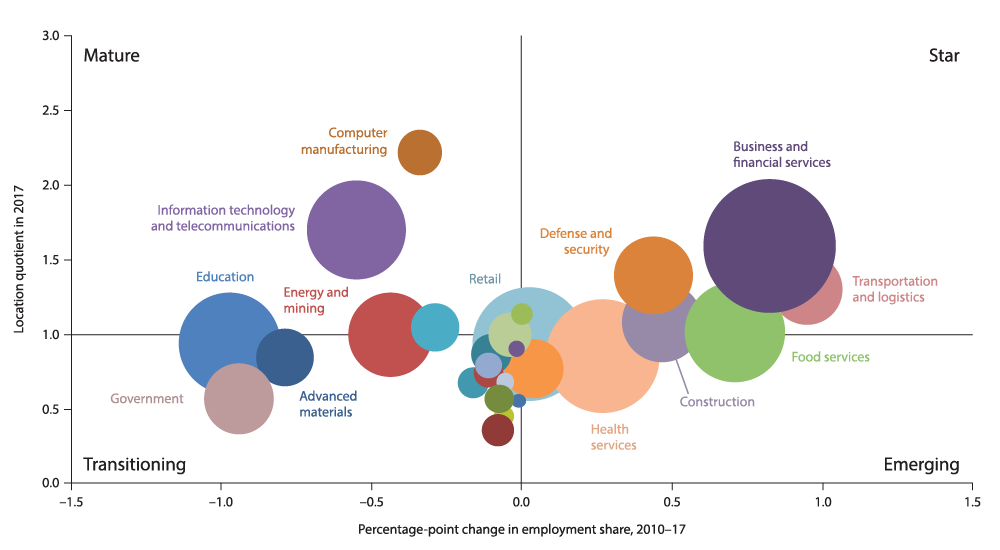
Industry cluster concentration is measured by location quotient (LQ), which compares the metro-area economy with the national economy (Chart 3.1). Growth within an industry cluster is measured by the percentage-point change in its share of local employment between 2010 and 2017.[2]

NOTE: Bubble size represents cluster share of metropolitan statistical area employment.
SOURCES: Texas Workforce Commission; Bureau of Labor Statistics.
Clusters in the top half of Chart 3.1, such as business and financial services and computer manufacturing, have a larger share of employment relative to the nation and, thus, an LQ greater than 1. These clusters are generally vital to the area’s economy and can be expanding relatively rapidly (“star”) or slowly (“mature”).
Those in the bottom half, such as advanced materials (semiconductors and fiber optics) and government, are less dominant locally than nationally and, hence, have an LQ below 1. “Emerging” clusters are fast growing, while those expanding slowly or declining are “transitioning.”
Not surprisingly, Dallas’ most important star clusters are business and financial services and defense and security. Business and financial services is the largest cluster, employing around 14 percent of the workforce in 2017. Some of Dallas’ largest employers are banking companies, such as JPMorgan Chase & Co. and Bank of America.
Liberty Mutual Insurance and State Farm Insurance have consolidated operations into the Dallas area, bringing thousands of jobs and making insurance one of the metro’s fastest-growing industries. The relocations are contributing to growth in the already large business and financial services cluster. The cluster has grown rapidly since 2010, increasing its employment share 0.8 percentage points from 2010 to 2017.
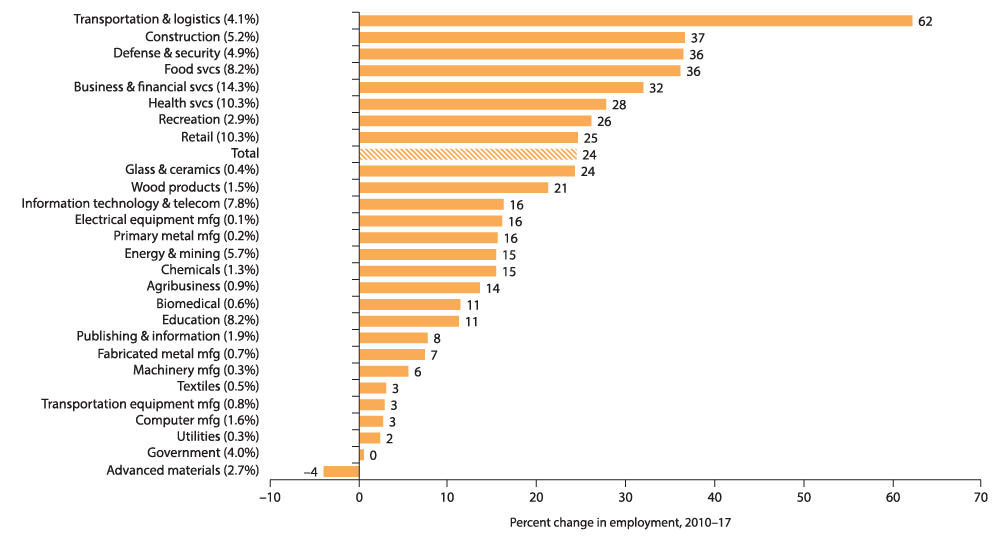
The Dallas area is also home to major technology companies, including Texas Instruments and AT&T. The information technology and telecommunications cluster employed about 8 percent of the metro’s workforce in 2017, growing 16 percent from 2010 to 2017 (Chart 3.2). During the peak of the high-tech boom, the Telecom Corridor was an expansive part of the Dallas area’s economy. The region was hard hit by the 2001 dot-com bust, but recovered and subsequently added the operations of numerous companies in technology and other fields.

NOTES: Percent change in employment is shown in whole numbers. Each cluster’s share of jobs is shown in parentheses (rounded to one decimal place).
SOURCES: Texas Workforce Commission; authors’ calculations.
Dallas has experienced a real estate boom since the end of the Great Recession, fueling growth in its construction sector. Employment expanded 37 percent in 2010–17, in line with the increase in Fort Worth and ahead of other metros in this report except Austin.
Defense and security, employing 5 percent of the workforce, has gained standing in Dallas. Employment in the energy and mining cluster grew 15 percent from 2010 to 2017, but its overall significance has declined as many energy companies moved business operations to Houston. Drilling for natural gas in North Texas’ Barnett Shale has slowed because of low natural gas prices.
Dallas’ neighbor, the Fort Worth–Arlington metropolitan division, also has dominant defense and energy clusters. Fort Worth–Arlington serves as a logistics and distribution hub with activity spilling into Dallas, where transportation and logistics was the fastest-growing cluster. Dallas and Fort Worth together are home to 22 Fortune 500 companies on the 2018 list.
Dallas’ star and mature clusters are relatively high paying and boast annual average earnings ($81,200) that are 28 percent higher than the annual average earnings in Dallas ($63,300) (Table 3.1). While real (inflation-adjusted) wages in the star and mature clusters grew an average 6.0 percent since 2010, wages in other less-prominent industry clusters climbed 11.4 percent.
| Cluster | Dallas | U.S. | |||||
| 2010 | 2012 | 2014 | 2016 | 2017 | 2017 | ||
| Computer manufacturing | 111,193 | 120,283 | 129,462 | 137,677 | 149,548 | 120,226 | |
| Information technology and telecommunications | 102,959 | 105,195 | 109,767 | 114,238 | 114,619 | 106,629 | |
| Business and financial services | 92,226 | 93,405 | 97,068 | 100,179 | 100,602 | 100,785 | |
| Defense and security | 83,346 | 82,943 | 86,025 | 90,224 | 91,077 | 91,226 | |
| Transportation and logistics | 53,813 | 53,451 | 53,615 | 52,764 | 51,432 | 53,761 | |
| Glass and ceramics | 56,201 | 57,573 | 63,951 | 66,544 | 68,153 | 55,398 | |
| Construction | 57,297 | 58,438 | 60,270 | 64,724 | 66,296 | 60,742 | |
| Publishing and information | 79,800 | 83,359 | 85,528 | 87,018 | 83,874 | 96,127 | |
| Food services | 20,135 | 19,708 | 19,202 | 20,165 | 20,433 | 18,963 | |
| Clusters with location quotient > 1 | 76,616 | 78,328 | 77,901 | 80,914 | 81,207 | – | |
| Clusters with location quotient < 1 | 54,099 | 53,724 | 58,910 | 59,787 | 60,245 | – | |
| Average earnings (total) | 59,859 | 60,559 | 61,132 | 63,032 | 63,315 | 55,375 | |
| NOTES: Clusters are listed in order of location quotient (LQ); clusters shown are those with LQs greater than 1. Earnings are in 2017 dollars. SOURCES: Texas Workforce Commission; Bureau of Labor Statistics; authors’ calculations. |
|||||||
Demographics: a destination for new arrivals
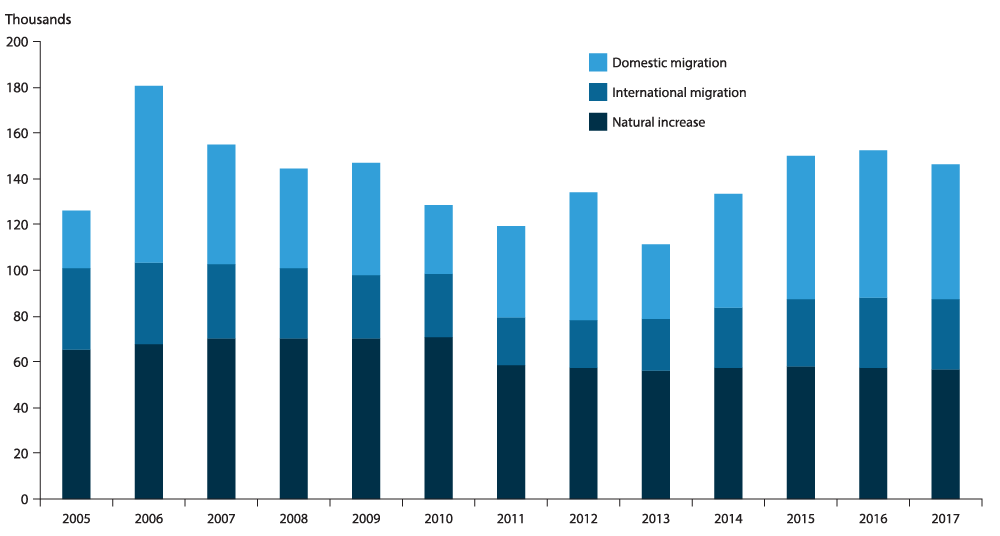
The Dallas–Fort Worth metroplex (Greater Dallas and Fort Worth components) has become a top domestic destination, although it has attracted many new residents from other countries as well. New arrivals from other parts of the U.S. accounted for 40 percent of DFW’s population increase in 2017 (Chart 3.3). Among U.S. metro areas, the metroplex experienced the highest population gains through total net migration from 2010 to 2017.

NOTE: Census Bureau population estimates approximate the population on July 1 of the year indicated and capture changes from the previous year.
SOURCE: Census Bureau.
Amid record migration, Dallas’ unemployment rate has remained low, averaging 3.6 percent in 2017. Per capita income and median household income are higher than national and Texas figures, and Dallas’ median household income increased 10.2 percent from 2014 to 2017 in real terms.
Dallas’ population is 44.1 percent non-Hispanic white. Hispanics make up a significant share of the area’s inhabitants, 29.7 percent. Foreign-born residents constitute 20.2 percent of the metro population, higher than their shares in Austin and San Antonio.
Dallas ranks second in educational attainment among the Texas metros in this report, with 36.5 percent of its adult residents holding a bachelor’s degree or higher. This is likely because the business and financial services, health care, education, information technology, and defense and security sectors employ a large share of the workforce and most require a college degree.
Employment: brisk growth amid oil bust, subsequent moderation
The Dallas economy proved resilient during the oil bust period. Area employment grew at an annualized 3.7 percent from December 2014 to December 2016—second only to Austin among the major Texas metros. Employment expansion was broad based, and nearly every major sector outpaced the state and nation over the two-year period. Trade, transportation and utilities; construction; professional and business services; and leisure and hospitality each grew at a more than 4 percent annual rate during the period. The Dallas area’s spurt has been fueled in part by business relocations and consolidations.
Dallas employment growth reached an annualized 2.6 percent in 2017, above its long-run (1990–2017) average growth of 2.2 percent and ahead of the state’s 2.1 percent increase. Job growth was particularly strong in the finance and insurance sector at 4.0 percent, primarily due to a 5.1 percent increase in insurance carriers and related activities employment. These gains are likely a result of the consolidation of employers such as State Farm, Liberty Mutual and JPMorgan Chase in the metro area. The Dallas unemployment rate dropped to 3.2 percent in October 2017—the lowest since 2000. It subsequently rose slightly and has averaged 3.5 percent in the first 10 months of 2018.
Amid the metro’s flourishing economy, the real estate market has boomed. Strong housing demand has boosted single-family homebuilding activity, with construction permits issued approaching or reaching double-digit growth every year from 2012 through 2015 and again in 2017. DFW placed first among the top markets for apartment deliveries in 2017.[3]
Outlook: faster job growth than the state
Dallas’ employment growth will likely continue to outperform the state and the nation in the medium term. The area still attracts business and financial services companies, which have reached a critical mass and can draw on a network of necessary support services. Overall growth is buoyed by a well-educated population, a competitive cost structure and the U.S. economy’s strength.
Dallas’ central location and its established network of highway, air and rail transportation will support expansion in its transportation and logistics sector, which makes up 4.1 percent of the region’s employment and is classified as a star among Dallas’ clusters. Denton and Collin counties are projected to be among the nation's fastest-growing economies from 2017 to 2021, according to an Oxford Economics forecast.[4] DFW will also benefit from ongoing expansion of firms such as Charles Schwab, which is expected to hire more than 2,000 additional workers at its Westlake Campus currently under construction in Tarrant County.[5]
Both the commercial real estate and housing markets in the metro area are expanding, but the pace of activity has begun to moderate. The rapid increase in home prices and rents over the past several years has reduced housing affordability. While this trend in price appreciation has eased, continued in-migration will likely support the market.
—Laila Assanie and Stephanie Gullo
| Dallas–Plano–Irving Growth Outlook | |
| Drivers | Challenges |
|
|
Notes
- The history of Dallas is taken from the Texas State Historical Association’s Handbook of Texas, tshaonline.org/handbook/online/articles/hdd01.
- The percentage shares of individual clusters do not add to 100 because some industries are counted in multiple clusters, and some industries are not counted at all based on cluster definitions. (See the appendix for more information.)
- See “Apartment Supply Volumes Peak at a 30-Year High in 2017,” by Kim O’Brien, Jan. 22, 2018, www.realpage.com/analytics/apartment-supply-volumes-peak-30-year-high-2017/.
- See “Dallas–Fort Worth Has Top Two Spots in U.S. Based on 5-Year Economic Forecast,” by Tracy M. Cook, Aug. 10, 2017, www.dallasnews.com/business/economy/2017/08/10/two-dallas-fort-worth-counties-lead-nation-economic-growth-potential-next-five-years.
- See “Charles Schwab to House 2,600 Employees with Initial Phase of Westlake Campus,” by Candice Carlisle, Sept. 20, 2017, www.bizjournals.com/dallas/news/2017/09/20/charles-schwab-to-house-2-600-employees-with.html, and “Schwab Now Expects to Bring 2,600 Jobs to New Campus North of Fort Worth,” by Gordon Dickson, Sept. 21, 2017, www.star-telegram.com/news/local/community/northeast-tarrant/article174565261.html.