Austin–Round Rock–San Marcos: Government and high tech at the state’s center
At a glance

Population (2023): |
2.5 million |
Population growth (2016–23): |
20.3 percent (Texas: 9.5 percent) |
Median household income (2023): |
$97,638 (Texas: $76,292) |
National MSA rank (2023): |
No. 26* |
| *The Austin–Round Rock–San Marcos metropolitan statistical area (MSA) encompasses Bastrop, Caldwell, Hays, Travis and Williamson counties. | |
- Austin’s political and educational influence arose from its position as the state capital and home to the University of Texas.
- Today, the region is a major high-tech hub for both the state and the U.S. and home to numerous large and small technology companies.
- Fueling Austin’s rapid economic expansion is a young and well-educated workforce.
- Businesses relocating operations from outside Texas have paced the metro’s development, as new arrivals sought to benefit from traditionally reasonable property and living costs. Technology and professional services firms have figured prominently in Austin’s recent growth.
History: A government, education and technology hub
Austin was established in 1839 as the capital of the Republic of Texas. The city became the westernmost railroad station along the Houston and Texas Central Railway in 1871, and with no other railroad towns for miles in most directions, it became a trading center.[1]
Austin’s status as Texas’ political center remained uncertain until 1872 when the city was chosen as the permanent capital in a statewide referendum. In 1881, it was selected as the site for the new University of Texas at Austin.
Oil-boom growth in the early 20th century largely bypassed Austin, and the city fell from its fourth-place population ranking in Texas in 1880 to 10th place in 1920. Completion of two dams in the early 1940s greatly aided the area’s subsequent growth.
Expansion of Austin’s key education and government sectors supported the region in the 1950s and 1960s. Buoyed by chamber of commerce efforts to expand the economic base and by a flourishing research program at UT, major technology firms such as IBM, Texas Instruments and Motorola began locating in the area in the late 1960s and early 1970s.
Austin gradually emerged as a high-tech center. Today, a sizeable share of the largest employers in the area are high-tech firms or semiconductor manufacturers.[2]
Industry clusters: Hotbed for high tech
Cluster concentration is measured by location quotients (LQs), which compare the metro-area and U.S. economies. Growth in a cluster is measured by the percentage-point change in its employment share from 2016 through 2023.[3]
Chart 2.1 displays the composition of industry clusters in Austin–Round Rock–San Marcos. The top two quadrants—“mature” and “star”—display industry clusters with a larger share of employment relative to the nation (LQs exceeding 1). These clusters are vital to the metro-area economy and can be expanding relatively rapidly (star) or growing relatively slowly (mature). Clusters shown in the bottom two quadrants—such as transportation and logistics and biomedical—are smaller relative to the nation (LQs below 1). These less-concentrated clusters are labeled either “emerging” if they are fast growing or “transitioning” if they are slow growing.
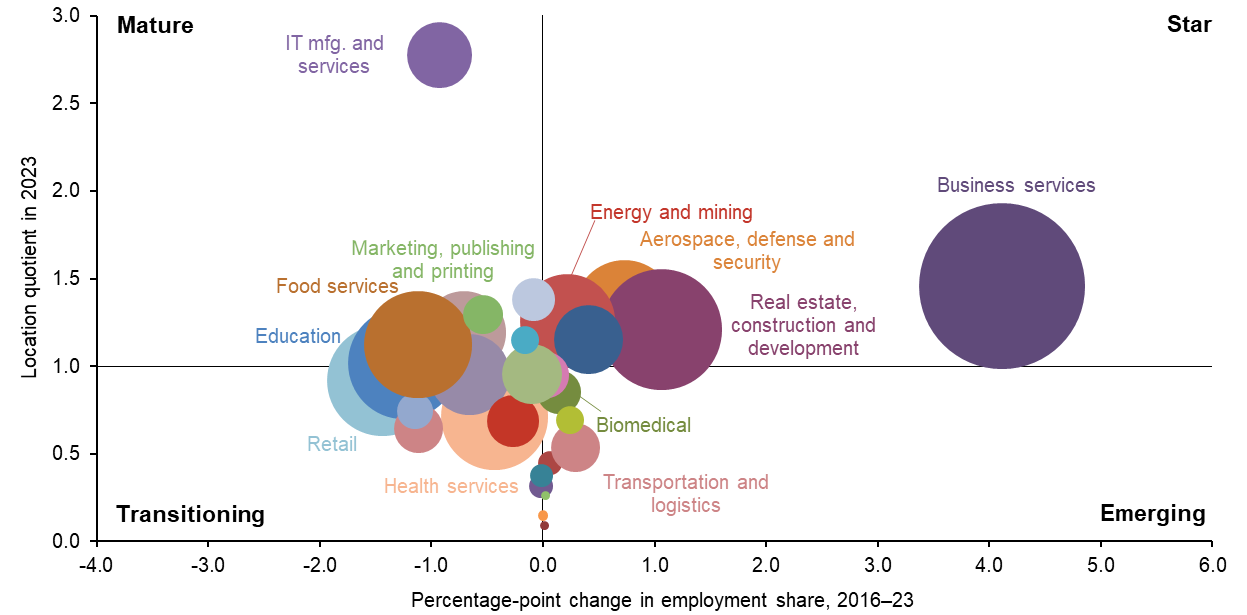
NOTE: Bubble size represents cluster share of metropolitan statistical area employment.
SOURCES: Texas Workforce Commission; Bureau of Labor Statistics.
The underpinnings of Austin’s economy are government, education and the technology industry. The state of Texas remains the largest employer, followed by UT. IT manufacturing and services boasts nearly three times the concentration in Austin than in the U.S., reflecting the significant presence of manufacturers of personal computers and related goods and services such as Dell, Apple, IBM, Samsung, Advanced Micro Devices, and Applied Materials.
Dell, with 12,000 local workers, and Tesla and Samsung, with 20,000 and 14,000 employees, respectively, are among the area’s largest employers.[4] Additionally, a sizable footprint from numerous software, data processing and hosting, and computing and systems design companies—including tech giants Apple, Google and Meta—make Austin’s business services cluster 1.5 times more concentrated than that of the nation. Business services employment grew rapidly from 2016 through 2023, continuing the robust expansion experienced in the prior decade (Chart 2.2).
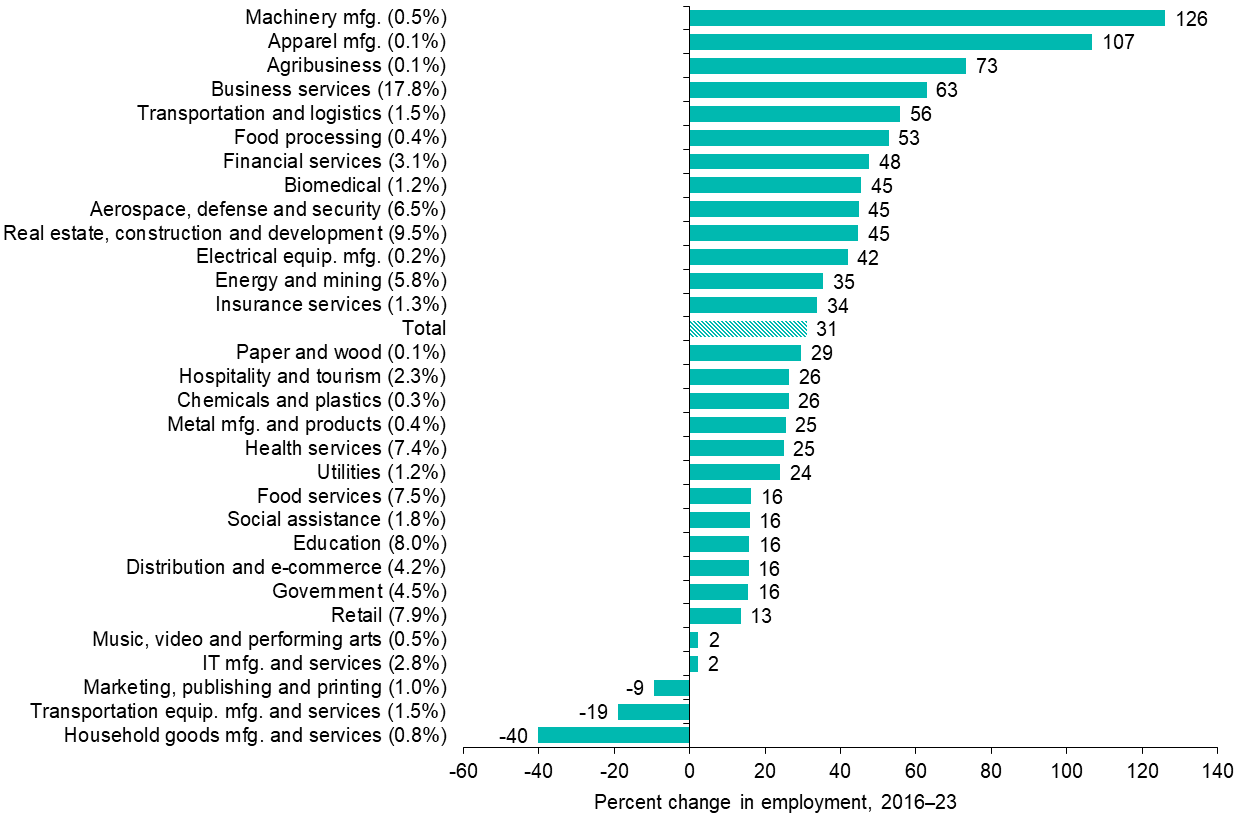
NOTES: Percent change in employment is shown in whole numbers. Each cluster’s normalized share of total jobs is shown in parentheses (rounded to one decimal place). Clusters with employment share less than 0.1 percent are not displayed.
SOURCES: Texas Workforce Commission; authors' calculations.
As the state capital and home to the flagship UT campus—a highly regarded research institution—Austin’s government and education sectors are large. Both the federal and state governments and the university are top area employers.
Furthermore, the metro boasts robust patent activity. In 2020, 4,953 patents were awarded to Austin inventors, accounting for 30.8 percent of total patents awarded in Texas. This has been supported by the activities of the University of Texas System, which ranked third domestically and sixth globally for patents granted to higher education institutions in 2024.[5]
Other concentrated clusters include aerospace, defense and security; energy and mining; real estate, construction and development; and marketing, publishing and printing. The aerospace, defense and security and construction and real estate sectors each grew by 45 percent from 2016 through 2023. Machinery manufacturing, agribusiness, and transportation and logistics are also among the fastest-growing employment clusters.
The food services cluster is important to the local economy. Along with hospitality and tourism services, this cluster highlights the tourist draws of such events as Austin City Limits and South by Southwest (SXSW). An Austin slogan, “Live Music Capital of the World,” is a nod to the numerous live venues. Austin’s music industry has diversified since 2013, with a widening range of performers and sites spread beyond the traditional Sixth Street district.[6]
The health cluster, which employs 7.4 percent of Austin’s workforce, has expanded in recent years. The second- and fifth-largest private sector employers in the city are Ascension Seton Healthcare Family, with over 14,000 employees, and St. David’s HealthCare, with more than 11,000 employees.[7] Though the concentration of health industry employment remains below that of the U.S. (LQ is 0.7), health cluster employment has increased 25 percent since 2016. The Dell Medical School at UT celebrated its 10th anniversary in 2024.
Austin’s star and mature clusters pay considerably higher wages than their less-concentrated counterparts (Table 2.1). IT manufacturing and services; aerospace, defense and security; and business services boast some of the region’s best-paying jobs. The average earnings within IT manufacturing and services were around $163,000 in Austin in 2023, double the metro’s average of about $82,000 across all sectors. Overall, Austin residents employed in the base clusters (those with LQs greater than 1) earn 38 percent more on average ($98,000) compared with those employed in less-concentrated clusters ($71,000).
| Cluster | Austin−Round Rock−San Marcos | U.S. | ||||
| 2016 | 2019 | 2021 | 2023 | 2023 | ||
| IT manufacturing and services | 147,884 | 165,391 | 175,246 | 163,163 | 131,681 | |
| Business services | 90,459 | 100,815 | 115,631 | 114,931 | 91,443 | |
| Utilities | 99,086 | 105,136 | 105,746 | 109,046 | 106,251 | |
| Aerospace, defense and security | 114,335 | 121,565 | 135,895 | 134,646 | 108,638 | |
| Marketing, publishing and printing | 87,177 | 99,978 | 123,846 | 96,990 | 87,049 | |
| Energy and mining | 110,540 | 120,492 | 129,067 | 123,949 | 107,531 | |
| Real estate, construction and development | 77,782 | 83,254 | 88,291 | 87,779 | 75,369 | |
| Government | 71,371 | 71,185 | 71,070 | 70,690 | 67,435 | |
| Financial services | 103,648 | 115,792 | 124,723 | 119,079 | 120,489 | |
| Music, video and performing arts | 67,289 | 61,387 | 81,173 | 69,774 | 78,454 | |
| Food services | 24,591 | 26,641 | 29,042 | 28,864 | 25,821 | |
| Education | 58,783 | 59,908 | 63,012 | 61,517 | 66,490 | |
| Clusters with location quotient > 1 | 88,814 | 95,848 | 103,562 | 98,369 | - | |
| Clusters with location quotient <= 1 | 66,220 | 66,984 | 72,249 | 71,329 | - | Average earnings (total) | 70,538 | 76,060 | 83,289 | 81,635 | 70,033 |
| NOTES: Clusters are listed in order of location quotient (LQ); clusters shown are those with LQs greater than 1 in 2023. Earnings are in 2023 dollars. SOURCES: Texas Workforce Commission; Bureau of Labor Statistics; authors' calculations. |
||||||
Moreover, wages in Austin’s top five most-concentrated clusters—IT manufacturing and services (LQ of 2.8), business services (LQ of 1.5), utilities (LQ of 1.4), aerospace, defense and security (LQ of 1.3) and marketing, publishing, and printing (LQ of 1.3)—were significantly higher than the national average for those clusters in 2023.
Demographics: Young, highly skilled talent pool
The Austin metro area’s strength is its young, diverse and well-educated workforce—its median age was three years younger than the U.S. median in 2023. The area ranks No. 1 in college education among the major Texas metros (Chart 2.3).
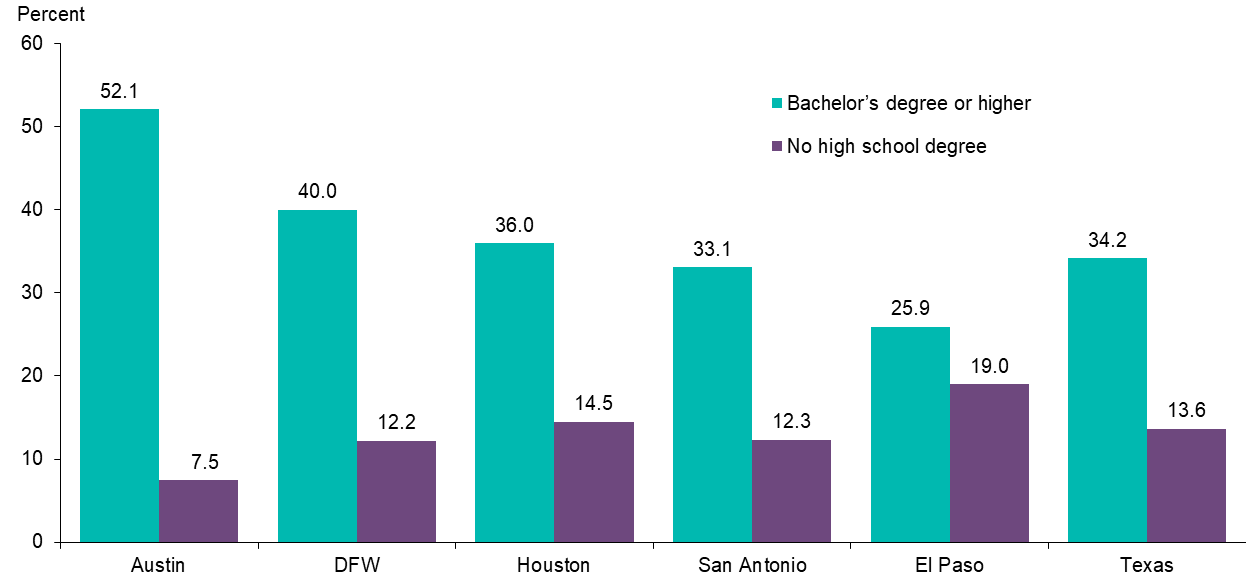
NOTE: Share of population age 25 and older. Shaded bars represent Texas data.
SOURCE: Census Bureau, 2023 American Community Survey 1-year estimates.
Austin ranked eighth on the list of the most-educated U.S. metros in 2025, according to a study by WalletHub.[8] In 2023, more than half of the adults (age 25 and older) in the metro area had at least an undergraduate college degree, compared with 34 percent in Texas. An educated workforce is a prime reason the metro area has attracted many high-tech companies and boasted a median household income of $97,638 in 2023, significantly higher than that of the state and nation.
Hispanics make up 32.2 percent of the area’s inhabitants, less than the share in Texas overall. Foreign-born residents constitute 16.0 percent of the metro population, lower than their share in Texas but slightly higher than the national average.
Employment: Strong rebound, unrelenting growth
Austin has been the leader in job growth among the Texas major metros over the past decade, including during the recovery from the pandemic. But employment losses in Austin during the pandemic were steep—a 12.3 percent decline from February to April 2020—exceeding the state’s drop of 11.2 percent during the same period. However, the area was the first major Texas metro to bounce back, regaining all lost jobs 15 months after the pandemic downturn began. In December 2024, total nonfarm employment was 19.4 percent higher than in February 2020 (before the onset of the pandemic).
Austin’s rapid postpandemic expansion has benefited from the metro’s outsized concentration of high-tech jobs—both in IT and in business and financial services. From December 2019 through December 2024, employment in professional, scientific and technical services increased 35.5 percent, and payrolls in information services grew 20.3 percent.
Overall, Austin payrolls grew 11.6 percent from December 2021 to December 2024, leading the rest of the state in the postpandemic period. The unemployment rate, 3.5 percent in December 2024, remained lower than both the nation and the state, a testament to both the strength of Austin’s economy and the ability of area enterprises to find workers. In 2025, Austin was the top performing metro in the U.S., according to the American Growth Project.[9]
Outlook: Moderate growth in expanding fields
Austin’s economy is dependent on technology enterprises, with 7.4 percent of its 2023 GDP generated from the information services sector. Funding for Austin startups increased in recent years, peaking in 2022 with $6.5 billion in new venture capital. Though funding slipped to $3.3 billion in 2023, it has picked up to $4.1 billion in the first half of 2025.[10]
Many of the area’s technology jobs are found in semiconductor manufacturing, including at Samsung, Tesla (which makes many of the chips used in its vehicles) and Advanced Micro Devices. The federal CHIPS and Science Act, signed into law in August 2022, which authorized funding for a range of technology and semiconductor-related projects, is expected to provide a catalyst for future local activity.
Austin is particularly well-positioned to take advantage of artificial intelligence (AI) and related emerging technologies. The sprawling countryside gives it the space it needs for data center development, while the metro’s access to inexpensive energy continues to feed that growth. Top AI employers, such as Apple, IBM, Google and Amazon, are already in Austin, as is the educated labor force required to make that technology work.[11]
Commercial real estate activity continued at an elevated pace after the pandemic, even as concerns emerged nationally about work-from-home arrangements and their impact on workplace space demand and office building financing. Consequently, office vacancies have risen sharply to record highs, and construction starts have stalled. Weakness in Austin’s office market is expected in the medium term because of the inventory of vacant space. Meanwhile, industrial real estate experienced record net absorption rates during 2023 and 2024, in part due to growth in advanced manufacturing such as spacecraft firm SpaceX’s Project Echo rocket test site in Bastrop County and increases in semiconductor and electric-vehicle manufacturing.[12] However, industrial market activity has moderated in 2025.
Significant in-migration to Austin from 2016 through 2023, along with housing-supply constraints that became pronounced in early 2020, helped elevate home and rental prices. The cost of housing has risen faster than many Austin workers’ paychecks, leading to decreased housing affordability.
As in many other metros, the residential market has showed signs of slowing since mid-2022, with home-price and rent declines and months’ supply of housing inventory exceeding prepandemic levels. Austin rents have been declining for the past three years, and the single-family home market has been subdued since 2023. Still, affordability remains a problem, with local government considering policy measures to improve housing access.
| Austin–Round Rock–San Marcos growth outlook | |
| Drivers | Challenges |
|
|
Notes
- The history of Austin has been adapted from the Texas State Historical Association’s Handbook of Texas.
- Detail about the largest Austin metro-area employers is provided by the Austin Chamber of Commerce.
- The percentage shares of individual clusters are normalized to add up to 100 and differ from individual industry share totals. Some industries are included in multiple clusters, while some others are omitted because they fall outside revised cluster definitions. (See the appendix for more information.)
- See note 2.
- Rankings of top 100 U.S. universities and top 100 worldwide universities granted utility patents is from the National Academy of Inventors.
- “Greater Austin Music Census 2022 Results,” Sound Music Cities.
- See note 2.
- “Most & Least Educated Cities in America (2025),” WalletHub.
- “Top-Performing EMAs for 2025,” The American Growth Project, Kenan Institute of Private Enterprise.
- “Austin Startup Ecosystem,” Opportunity Austin.
- “Mapping the AI Economy: Which Regions are Ready for the Next Technological Leap?” Brookings Institution, July 2025.
- “Austin Industrial Market Snapshot, Q4 2023,” AVANT by Avison Young, CoStar. See also, “Austin Industrial Market Snapshot, Q4 2024,” AVANT by Avison Young, CoStar.